

177
Modeling Stream Flow Changes
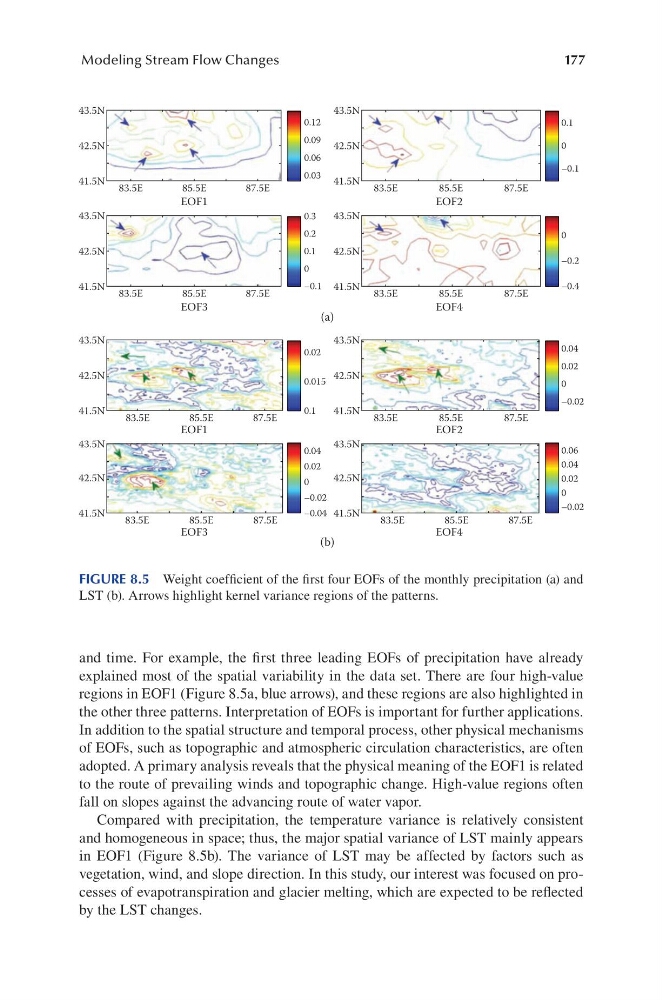
and time. For example, the first three leading EOFs of precipitation have already
explained most of the spatial variability in the data set. There are four high-value
regions in EOF1 (Figure 8.5a, blue arrows), and these regions are also highlighted in
the other three patterns. Interpretation of EOFs is important for further applications.
In addition to the spatial structure and temporal process, other physical mechanisms
of EOFs, such as topographic and atmospheric circulation characteristics, are often
adopted. A primary analysis reveals that the physical meaning of the EOF1 is related
to the route of prevailing winds and topographic change. High-value regions often
fall on slopes against the advancing route of water vapor.
Compared with precipitation, the temperature variance is relatively consistent
and homogeneous in space; thus, the major spatial variance of LST mainly appears
in EOF1 (Figure 8.5b). The variance of LST may be affected by factors such as
vegetation, wind, and slope direction. In this study, our interest was focused on processes of evapotranspiration and glacier melting, which are expected to be reflected
by the LST changes.
43.5N
42.5N
41.5N 83.5E
85.5E
EOF1
87.5E
43.5N
42.5N
41.5N 83.5E
85.5E
EOF3
87.5E
43.5N
42.5N
41.5N 83.5E
85.5E
EOF2
87.5E
43.5N
42.5N
41.5N 83.5E
85.5E
EOF4
87.5E
43.5N
42.5N
41.5N
83.5E
85.5E
EOF1
87.5E
43.5N
42.5N
41.5N
83.5E
85.5E
EOF3
87.5E
43.5N
42.5N
41.5N 83.5E
85.5E
EOF2
87.5E
43.5N
42.5N
41.5N
83.5E
85.5E
EOF4
87.5E
0.12
0.09
0.06
0.03
0.3
0.2
0.1
0
–0.1
0.02
0.015
0.1
0.04
0.06
0.04
0.02
–0.02
0
0.04
–0.4
–0.2
–0.1
0.1
0
0
0.02
–0.02
0
0.02
–0.02
–0.04
0
(a)
(b)
FIGURE 8.5 Weight coefficient of the first four EOFs of the monthly precipitation (a) and
LST (b). Arrows highlight kernel variance regions of the patterns.
Modeling Stream Flow Changes
and time. For example, the first three leading EOFs of precipitation have already
explained most of the spatial variability in the data set. There are four high-value
regions in EOF1 (Figure 8.5a, blue arrows), and these regions are also highlighted in
the other three patterns. Interpretation of EOFs is important for further applications.
In addition to the spatial structure and temporal process, other physical mechanisms
of EOFs, such as topographic and atmospheric circulation characteristics, are often
adopted. A primary analysis reveals that the physical meaning of the EOF1 is related
to the route of prevailing winds and topographic change. High-value regions often
fall on slopes against the advancing route of water vapor.
Compared with precipitation, the temperature variance is relatively consistent
and homogeneous in space; thus, the major spatial variance of LST mainly appears
in EOF1 (Figure 8.5b). The variance of LST may be affected by factors such as
vegetation, wind, and slope direction. In this study, our interest was focused on processes of evapotranspiration and glacier melting, which are expected to be reflected
by the LST changes.
43.5N
42.5N
41.5N 83.5E
85.5E
EOF1
87.5E
43.5N
42.5N
41.5N 83.5E
85.5E
EOF3
87.5E
43.5N
42.5N
41.5N 83.5E
85.5E
EOF2
87.5E
43.5N
42.5N
41.5N 83.5E
85.5E
EOF4
87.5E
43.5N
42.5N
41.5N
83.5E
85.5E
EOF1
87.5E
43.5N
42.5N
41.5N
83.5E
85.5E
EOF3
87.5E
43.5N
42.5N
41.5N 83.5E
85.5E
EOF2
87.5E
43.5N
42.5N
41.5N
83.5E
85.5E
EOF4
87.5E
0.12
0.09
0.06
0.03
0.3
0.2
0.1
0
–0.1
0.02
0.015
0.1
0.04
0.06
0.04
0.02
–0.02
0
0.04
–0.4
–0.2
–0.1
0.1
0
0
0.02
–0.02
0
0.02
–0.02
–0.04
0
(a)
(b)
FIGURE 8.5 Weight coefficient of the first four EOFs of the monthly precipitation (a) and
LST (b). Arrows highlight kernel variance regions of the patterns.