

176
Multiscale Hydrologic Remote Sensing: Perspectives and Applications
according to a general rule proposed by North et al. (1982) that, to some extent,
ensures that the leading EOFs explain most physical meanings or implications
embedded in the system (described in Section 8.4.2). In summary, the EOF analysis
yields not only spatial patterns but also their temporal processes correspondingly,
which can be used for periodic analysis, interpolation, and forecasting (Loboda et al.
2005), although this is not the focus in this study.
8.4.2 SPatial PatteRnS of the fiRSt fouR leading eofS
Standard deviation is often used to describe variance in statistics. Both leading EOFs
and standard deviation can reveal and interpret variance in a field. Although the leading EOFs are often similar to the characteristics of standard deviation, the EOFs have
more comparative advantages than standard deviation. Besides, the spatiotemporal
patterns of the first four EOFs for precipitation and temperature (Figure 8.5) may
exhibit relatively lucid and integrated spatial structures. These spatial structures of
succeeding patterns are gradually scattered but coherently concatenated over space
45N
44N
43N
42N
41N
40N
82E
83E
84E
85E
86E
87E
88E
89E
90E
331
276
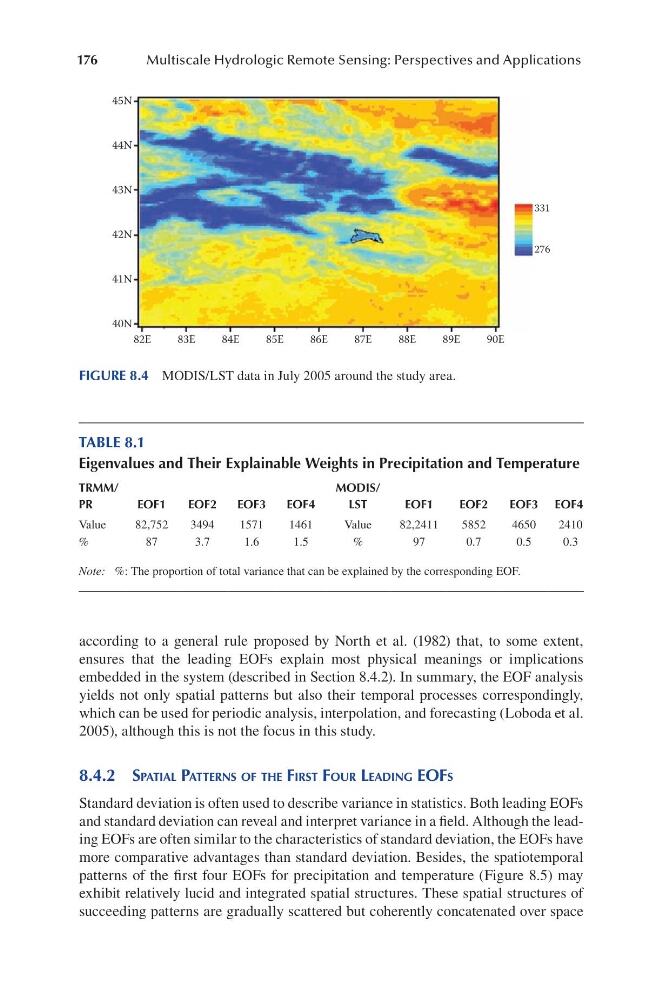
FIGURE 8.4 MODIS/LST data in July 2005 around the study area.
TABLE 8.1
Eigenvalues and Their Explainable Weights in Precipitation and Temperature
TRMM/
PR
EOF1
EOF2
EOF3
EOF4
MODIS/
LST
EOF1
EOF2
EOF3 EOF4
Value
82,752
3494
1571
1461
Value
82,2411
5852
4650
2410
%
87
3.7
1.6
1.5
%
97
0.7
0.5
0.3
Note: %: The proportion of total variance that can be explained by the corresponding EOF.
Multiscale Hydrologic Remote Sensing: Perspectives and Applications
according to a general rule proposed by North et al. (1982) that, to some extent,
ensures that the leading EOFs explain most physical meanings or implications
embedded in the system (described in Section 8.4.2). In summary, the EOF analysis
yields not only spatial patterns but also their temporal processes correspondingly,
which can be used for periodic analysis, interpolation, and forecasting (Loboda et al.
2005), although this is not the focus in this study.
8.4.2 SPatial PatteRnS of the fiRSt fouR leading eofS
Standard deviation is often used to describe variance in statistics. Both leading EOFs
and standard deviation can reveal and interpret variance in a field. Although the leading EOFs are often similar to the characteristics of standard deviation, the EOFs have
more comparative advantages than standard deviation. Besides, the spatiotemporal
patterns of the first four EOFs for precipitation and temperature (Figure 8.5) may
exhibit relatively lucid and integrated spatial structures. These spatial structures of
succeeding patterns are gradually scattered but coherently concatenated over space
45N
44N
43N
42N
41N
40N
82E
83E
84E
85E
86E
87E
88E
89E
90E
331
276
FIGURE 8.4 MODIS/LST data in July 2005 around the study area.
TABLE 8.1
Eigenvalues and Their Explainable Weights in Precipitation and Temperature
TRMM/
PR
EOF1
EOF2
EOF3
EOF4
MODIS/
LST
EOF1
EOF2
EOF3 EOF4
Value
82,752
3494
1571
1461
Value
82,2411
5852
4650
2410
%
87
3.7
1.6
1.5
%
97
0.7
0.5
0.3
Note: %: The proportion of total variance that can be explained by the corresponding EOF.