

157
Remote Sensing Drought Assessment in a Coastal Urban Region
drought condition was more severe in 1987 than that in 2000. Yet, the remaining
question is why the values of TVDI_NDVI showed such a disparate outcome.
Because of the effects of soil background, linkages between RWSI and TVDIs
(TVDI_NDVI, TVDI_SAVI TVDI_ANDVI, and TVDI_MSAVI) would be more
meaningful if the same intervals of 0.01 used for RWSI were employed as drought
intensity categories. With this classification scheme, the space–time soil moisture
dynamics in the nexus of RWSI, TVDI, and relative soil moisture changes could be
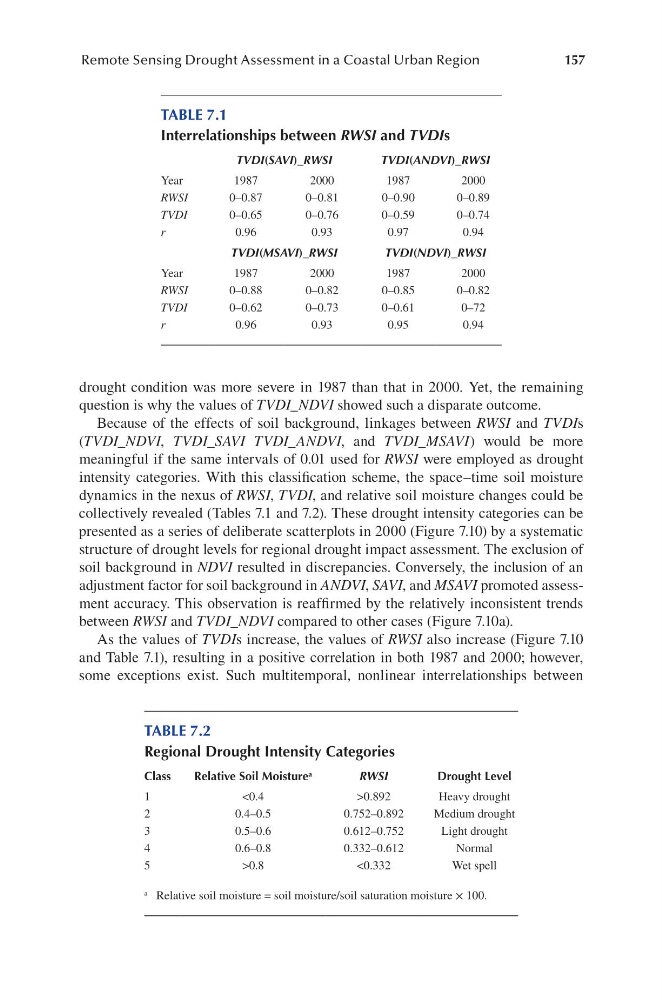
collectively revealed (Tables 7.1 and 7.2). These drought intensity categories can be
presented as a series of deliberate scatterplots in 2000 (Figure 7.10) by a systematic
structure of drought levels for regional drought impact assessment. The exclusion of
soil background in NDVI resulted in discrepancies. Conversely, the inclusion of an
adjustment factor for soil background in ANDVI, SAVI, and MSAVI promoted assessment accuracy. This observation is reaffirmed by the relatively inconsistent trends
between RWSI and TVDI_NDVI compared to other cases (Figure 7.10a).
As the values of TVDIs increase, the values of RWSI also increase (Figure 7.10
and Table 7.1), resulting in a positive correlation in both 1987 and 2000; however,
some exceptions exist. Such multitemporal, nonlinear interrelationships between
TABLE 7.1
Interrelationships between rWSI and tVDIs
tVDI(SaVI)_rWSI
tVDI(aNDVI)_rWSI
Year
1987
2000
1987
2000
RWSI
0–0.87
0–0.81
0–0.90
0–0.89
TVDI
0–0.65
0–0.76
0–0.59
0–0.74
r
0.96
0.93
0.97
0.94
tVDI(MSaVI)_rWSI
tVDI(NDVI)_rWSI
Year
1987
2000
1987
2000
RWSI
0–0.88
0–0.82
0–0.85
0–0.82
TVDI
0–0.62
0–0.73
0–0.61
0–72
r
0.96
0.93
0.95
0.94
TABLE 7.2
Regional Drought Intensity Categories
Class
Relative Soil Moisture a
rWSI
Drought Level
1
<0.4
>0.892
Heavy drought
2
0.4–0.5
0.752–0.892
Medium drought
3
0.5–0.6
0.612–0.752
Light drought
4
0.6–0.8
0.332–0.612
Normal
5
>0.8
<0.332
Wet spell
a Relative soil moisture = soil moisture/soil saturation moisture × 100.
Remote Sensing Drought Assessment in a Coastal Urban Region
drought condition was more severe in 1987 than that in 2000. Yet, the remaining
question is why the values of TVDI_NDVI showed such a disparate outcome.
Because of the effects of soil background, linkages between RWSI and TVDIs
(TVDI_NDVI, TVDI_SAVI TVDI_ANDVI, and TVDI_MSAVI) would be more
meaningful if the same intervals of 0.01 used for RWSI were employed as drought
intensity categories. With this classification scheme, the space–time soil moisture
dynamics in the nexus of RWSI, TVDI, and relative soil moisture changes could be
collectively revealed (Tables 7.1 and 7.2). These drought intensity categories can be
presented as a series of deliberate scatterplots in 2000 (Figure 7.10) by a systematic
structure of drought levels for regional drought impact assessment. The exclusion of
soil background in NDVI resulted in discrepancies. Conversely, the inclusion of an
adjustment factor for soil background in ANDVI, SAVI, and MSAVI promoted assessment accuracy. This observation is reaffirmed by the relatively inconsistent trends
between RWSI and TVDI_NDVI compared to other cases (Figure 7.10a).
As the values of TVDIs increase, the values of RWSI also increase (Figure 7.10
and Table 7.1), resulting in a positive correlation in both 1987 and 2000; however,
some exceptions exist. Such multitemporal, nonlinear interrelationships between
TABLE 7.1
Interrelationships between rWSI and tVDIs
tVDI(SaVI)_rWSI
tVDI(aNDVI)_rWSI
Year
1987
2000
1987
2000
RWSI
0–0.87
0–0.81
0–0.90
0–0.89
TVDI
0–0.65
0–0.76
0–0.59
0–0.74
r
0.96
0.93
0.97
0.94
tVDI(MSaVI)_rWSI
tVDI(NDVI)_rWSI
Year
1987
2000
1987
2000
RWSI
0–0.88
0–0.82
0–0.85
0–0.82
TVDI
0–0.62
0–0.73
0–0.61
0–72
r
0.96
0.93
0.95
0.94
TABLE 7.2
Regional Drought Intensity Categories
Class
Relative Soil Moisture a
rWSI
Drought Level
1
<0.4
>0.892
Heavy drought
2
0.4–0.5
0.752–0.892
Medium drought
3
0.5–0.6
0.612–0.752
Light drought
4
0.6–0.8
0.332–0.612
Normal
5
>0.8
<0.332
Wet spell
a Relative soil moisture = soil moisture/soil saturation moisture × 100.