

158
Multiscale Hydrologic Remote Sensing: Perspectives and Applications
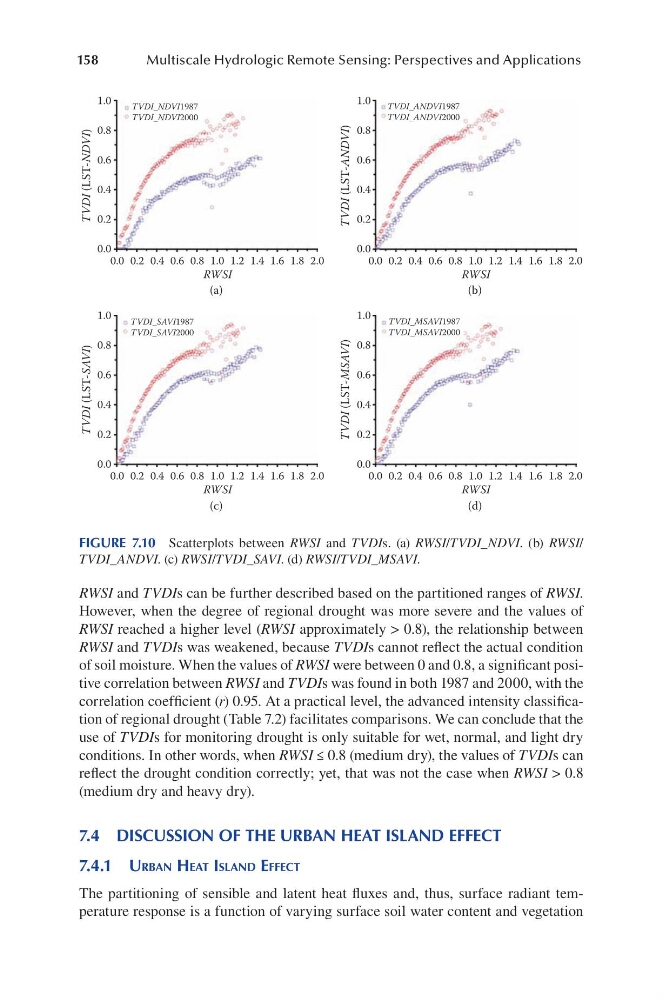
RWSI and TVDIs can be further described based on the partitioned ranges of RWSI.
However, when the degree of regional drought was more severe and the values of
RWSI reached a higher level (RWSI approximately > 0.8), the relationship between
RWSI and TVDIs was weakened, because TVDIs cannot reflect the actual condition
of soil moisture. When the values of RWSI were between 0 and 0.8, a significant positive correlation between RWSI and TVDIs was found in both 1987 and 2000, with the
correlation coefficient (r) 0.95. At a practical level, the advanced intensity classification of regional drought (Table 7.2) facilitates comparisons. We can conclude that the
use of TVDIs for monitoring drought is only suitable for wet, normal, and light dry
conditions. In other words, when RWSI ≤ 0.8 (medium dry), the values of TVDIs can
reflect the drought condition correctly; yet, that was not the case when RWSI > 0.8
(medium dry and heavy dry).
7.4 DISCUSSION OF THE URBAN HEAT ISLAND EFFECT
7.4.1 uRBan heat iSland effect
The partitioning of sensible and latent heat fluxes and, thus, surface radiant temperature response is a function of varying surface soil water content and vegetation
(a)
(b)
(c)
(d)
1.0
0.8
0.6
0.4
0.2
0.0
0.0 0.2 0.4 0.6 0.8 1.0 1.2 1.4 1.6 1.8 2.0
RWSI
0.0 0.2 0.4 0.6 0.8 1.0 1.2 1.4 1.6 1.8 2.0
RWSI
0.0 0.2 0.4 0.6 0.8 1.0 1.2 1.4 1.6 1.8 2.0
RWSI
0.0 0.2 0.4 0.6 0.8 1.0 1.2 1.4 1.6 1.8 2.0
RWSI
TVDI (LST-NDVI)
TVDI (LST-ANDVI)
1.0
0.8
0.6
0.4
0.2
0.0
1.0
0.8
0.6
0.4
0.2
0.0
1.0
0.8
0.6
0.4
0.2
0.0
TVDI (LST-SAVI)
TVDI (LST-MSAVI)
TVDI_NDVI1987
TVDI_NDVI2000
TVDI_ANDVI1987
TVDI_ANDVI2000
TVDI_MSAVI1987
TVDI_MSAVI2000
TVDI_SAVI1987
TVDI_SAVI2000
FIGURE 7.10 Scatterplots between RWSI and TVDIs. (a) RWSI/TVDI_NDVI. (b) RWSI/
TVDI_ANDVI. (c) RWSI/TVDI_SAVI. (d) RWSI/TVDI_MSAVI.
Multiscale Hydrologic Remote Sensing: Perspectives and Applications
RWSI and TVDIs can be further described based on the partitioned ranges of RWSI.
However, when the degree of regional drought was more severe and the values of
RWSI reached a higher level (RWSI approximately > 0.8), the relationship between
RWSI and TVDIs was weakened, because TVDIs cannot reflect the actual condition
of soil moisture. When the values of RWSI were between 0 and 0.8, a significant positive correlation between RWSI and TVDIs was found in both 1987 and 2000, with the
correlation coefficient (r) 0.95. At a practical level, the advanced intensity classification of regional drought (Table 7.2) facilitates comparisons. We can conclude that the
use of TVDIs for monitoring drought is only suitable for wet, normal, and light dry
conditions. In other words, when RWSI ≤ 0.8 (medium dry), the values of TVDIs can
reflect the drought condition correctly; yet, that was not the case when RWSI > 0.8
(medium dry and heavy dry).
7.4 DISCUSSION OF THE URBAN HEAT ISLAND EFFECT
7.4.1 uRBan heat iSland effect
The partitioning of sensible and latent heat fluxes and, thus, surface radiant temperature response is a function of varying surface soil water content and vegetation
(a)
(b)
(c)
(d)
1.0
0.8
0.6
0.4
0.2
0.0
0.0 0.2 0.4 0.6 0.8 1.0 1.2 1.4 1.6 1.8 2.0
RWSI
0.0 0.2 0.4 0.6 0.8 1.0 1.2 1.4 1.6 1.8 2.0
RWSI
0.0 0.2 0.4 0.6 0.8 1.0 1.2 1.4 1.6 1.8 2.0
RWSI
0.0 0.2 0.4 0.6 0.8 1.0 1.2 1.4 1.6 1.8 2.0
RWSI
TVDI (LST-NDVI)
TVDI (LST-ANDVI)
1.0
0.8
0.6
0.4
0.2
0.0
1.0
0.8
0.6
0.4
0.2
0.0
1.0
0.8
0.6
0.4
0.2
0.0
TVDI (LST-SAVI)
TVDI (LST-MSAVI)
TVDI_NDVI1987
TVDI_NDVI2000
TVDI_ANDVI1987
TVDI_ANDVI2000
TVDI_MSAVI1987
TVDI_MSAVI2000
TVDI_SAVI1987
TVDI_SAVI2000
FIGURE 7.10 Scatterplots between RWSI and TVDIs. (a) RWSI/TVDI_NDVI. (b) RWSI/
TVDI_ANDVI. (c) RWSI/TVDI_SAVI. (d) RWSI/TVDI_MSAVI.