

156
Multiscale Hydrologic Remote Sensing: Perspectives and Applications
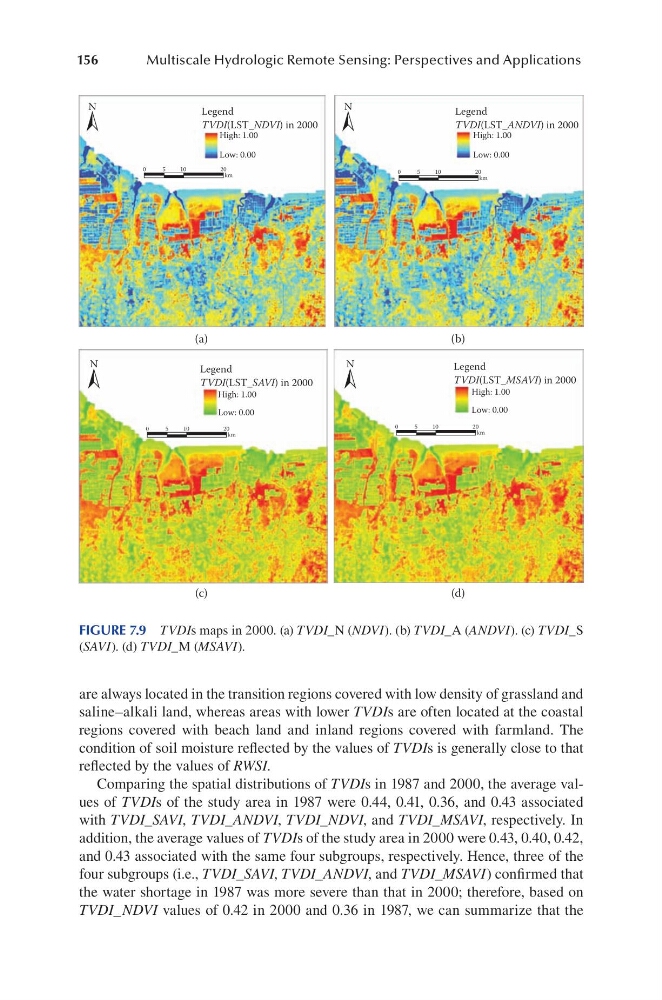
are always located in the transition regions covered with low density of grassland and
saline–alkali land, whereas areas with lower TVDIs are often located at the coastal
regions covered with beach land and inland regions covered with farmland. The
condition of soil moisture reflected by the values of TVDIs is generally close to that
reflected by the values of RWSI.
Comparing the spatial distributions of TVDIs in 1987 and 2000, the average values of TVDIs of the study area in 1987 were 0.44, 0.41, 0.36, and 0.43 associated
with TVDI_SAVI, TVDI_ANDVI, TVDI_NDVI, and TVDI_MSAVI, respectively. In
addition, the average values of TVDIs of the study area in 2000 were 0.43, 0.40, 0.42,
and 0.43 associated with the same four subgroups, respectively. Hence, three of the
four subgroups (i.e., TVDI_SAVI, TVDI_ANDVI, and TVDI_MSAVI) confirmed that
the water shortage in 1987 was more severe than that in 2000; therefore, based on
TVDI_NDVI values of 0.42 in 2000 and 0.36 in 1987, we can summarize that the
(a)
(b)
(c)
(d)
N
N
N
N
0
5
10
20
km
0
5
10
20
km
0
5
10
20
km
0
5
10
20
km
Legend
TVDI(LST_NDVI) in 2000
High: 1.00
Low: 0.00
Legend
TVDI(LST_ANDVI) in 2000
High: 1.00
Low: 0.00
Legend
TVDI(LST_MSAVI) in 2000
High: 1.00
Low: 0.00
Legend
TVDI(LST_SAVI) in 2000
High: 1.00
Low: 0.00
FIGURE 7.9 TVDIs maps in 2000. (a) TVDI_N (NDVI). (b) TVDI_A (ANDVI). (c) TVDI_S
(SAVI). (d) TVDI_M (MSAVI).
Multiscale Hydrologic Remote Sensing: Perspectives and Applications
are always located in the transition regions covered with low density of grassland and
saline–alkali land, whereas areas with lower TVDIs are often located at the coastal
regions covered with beach land and inland regions covered with farmland. The
condition of soil moisture reflected by the values of TVDIs is generally close to that
reflected by the values of RWSI.
Comparing the spatial distributions of TVDIs in 1987 and 2000, the average values of TVDIs of the study area in 1987 were 0.44, 0.41, 0.36, and 0.43 associated
with TVDI_SAVI, TVDI_ANDVI, TVDI_NDVI, and TVDI_MSAVI, respectively. In
addition, the average values of TVDIs of the study area in 2000 were 0.43, 0.40, 0.42,
and 0.43 associated with the same four subgroups, respectively. Hence, three of the
four subgroups (i.e., TVDI_SAVI, TVDI_ANDVI, and TVDI_MSAVI) confirmed that
the water shortage in 1987 was more severe than that in 2000; therefore, based on
TVDI_NDVI values of 0.42 in 2000 and 0.36 in 1987, we can summarize that the
(a)
(b)
(c)
(d)
N
N
N
N
0
5
10
20
km
0
5
10
20
km
0
5
10
20
km
0
5
10
20
km
Legend
TVDI(LST_NDVI) in 2000
High: 1.00
Low: 0.00
Legend
TVDI(LST_ANDVI) in 2000
High: 1.00
Low: 0.00
Legend
TVDI(LST_MSAVI) in 2000
High: 1.00
Low: 0.00
Legend
TVDI(LST_SAVI) in 2000
High: 1.00
Low: 0.00
FIGURE 7.9 TVDIs maps in 2000. (a) TVDI_N (NDVI). (b) TVDI_A (ANDVI). (c) TVDI_S
(SAVI). (d) TVDI_M (MSAVI).