

155
Remote Sensing Drought Assessment in a Coastal Urban Region
the regional monitoring of soil moisture and drought impact assessment. This study
particularly concatenated on the integration between RWSI and TVDI to develop a
composite indicator for drought impact assessment. This new scheme sets RWSI as a
reference base to address regional water deficit with respect to four intensity categories coupled with a suite of TVDIs (i.e., TVDI_NDVI, TVDI_ANDVI, TVDI_SAVI,
and TVDI_MSAVI) concomitantly. This synergistic approach results in a more adaptive way of assessing drought impact.
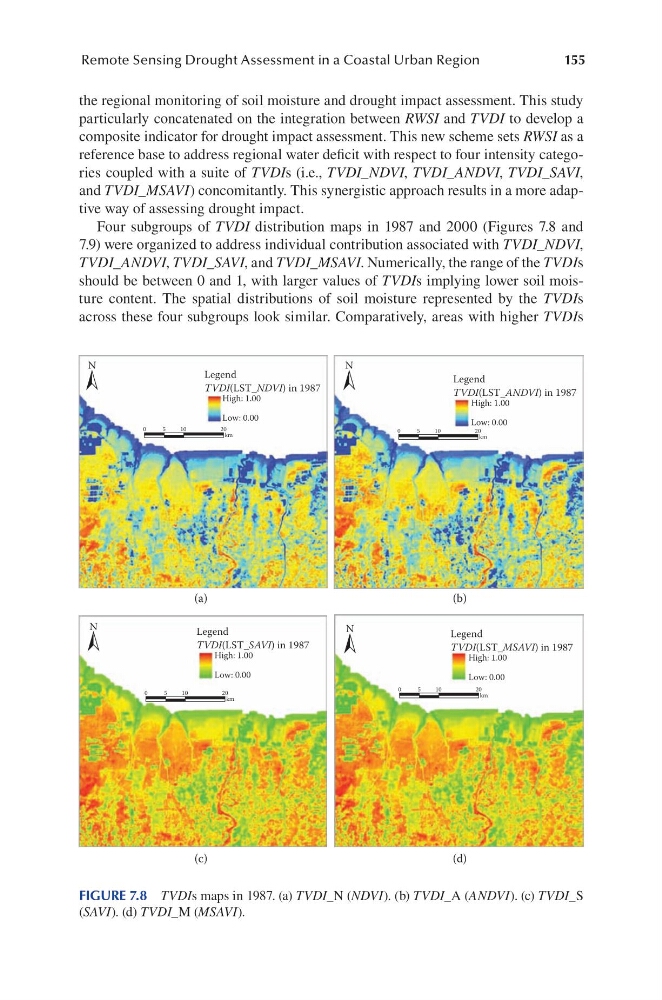
Four subgroups of TVDI distribution maps in 1987 and 2000 (Figures 7.8 and
7.9) were organized to address individual contribution associated with TVDI_NDVI,
TVDI_ANDVI, TVDI_SAVI, and TVDI_MSAVI. Numerically, the range of the TVDIs
should be between 0 and 1, with larger values of TVDIs implying lower soil moisture content. The spatial distributions of soil moisture represented by the TVDIs
across these four subgroups look similar. Comparatively, areas with higher TVDIs
(a)
(b)
(c)
(d)
N
N
0
5
10
20
km
0
5
10
20
km
Legend
TVDI(LST_NDVI) in 1987
High: 1.00
Low: 0.00
Legend
TVDI(LST_ANDVI) in 1987
High: 1.00
Low: 0.00
N
N
0
5
10
20
km
0
5
10
20
km
Legend
TVDI(LST_SAVI) in 1987
High: 1.00
Low: 0.00
Legend
TVDI(LST_MSAVI) in 1987
High: 1.00
Low: 0.00
FIGURE 7.8 TVDIs maps in 1987. (a) TVDI_N (NDVI). (b) TVDI_A (ANDVI). (c) TVDI_S
(SAVI). (d) TVDI_M (MSAVI).
Remote Sensing Drought Assessment in a Coastal Urban Region
the regional monitoring of soil moisture and drought impact assessment. This study
particularly concatenated on the integration between RWSI and TVDI to develop a
composite indicator for drought impact assessment. This new scheme sets RWSI as a
reference base to address regional water deficit with respect to four intensity categories coupled with a suite of TVDIs (i.e., TVDI_NDVI, TVDI_ANDVI, TVDI_SAVI,
and TVDI_MSAVI) concomitantly. This synergistic approach results in a more adaptive way of assessing drought impact.
Four subgroups of TVDI distribution maps in 1987 and 2000 (Figures 7.8 and
7.9) were organized to address individual contribution associated with TVDI_NDVI,
TVDI_ANDVI, TVDI_SAVI, and TVDI_MSAVI. Numerically, the range of the TVDIs
should be between 0 and 1, with larger values of TVDIs implying lower soil moisture content. The spatial distributions of soil moisture represented by the TVDIs
across these four subgroups look similar. Comparatively, areas with higher TVDIs
(a)
(b)
(c)
(d)
N
N
0
5
10
20
km
0
5
10
20
km
Legend
TVDI(LST_NDVI) in 1987
High: 1.00
Low: 0.00
Legend
TVDI(LST_ANDVI) in 1987
High: 1.00
Low: 0.00
N
N
0
5
10
20
km
0
5
10
20
km
Legend
TVDI(LST_SAVI) in 1987
High: 1.00
Low: 0.00
Legend
TVDI(LST_MSAVI) in 1987
High: 1.00
Low: 0.00
FIGURE 7.8 TVDIs maps in 1987. (a) TVDI_N (NDVI). (b) TVDI_A (ANDVI). (c) TVDI_S
(SAVI). (d) TVDI_M (MSAVI).