

154
Multiscale Hydrologic Remote Sensing: Perspectives and Applications
7.3.2 Building a RelationShiP Between TVDI and
RWSI foR dRought iMPact aSSeSSMent
A clear pathway for drought impact assessment is found in a region where soil moisture changes from dry to wet as the land cover changes from bare soil to closed
vegetation (Figure 7.3). Such a change would make the LST data of all pixels form
a trapezoidal region in a two-dimensional plain (Moron et al. 1994). The borders
of this trapezoid in the LST–NDVI scatterplot (Figure 7.3) can be determined by
analyzing extreme soil conditions from bare soil and closed vegetation, to saturated
soil, and soil with minimum water content. Clearly, when surface evaporation and
transpiration are stronger, the values of LST become lower, and the soil moisture
content becomes higher, making the distribution of points (NDVI, LST) closer to the
border of wet conditions.
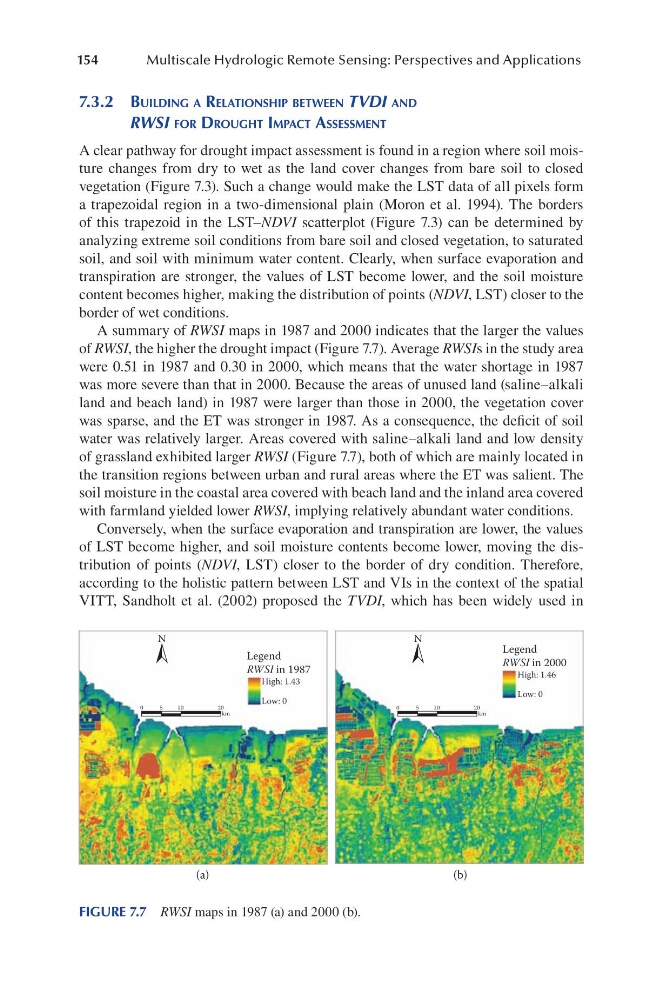
A summary of RWSI maps in 1987 and 2000 indicates that the larger the values
of RWSI, the higher the drought impact (Figure 7.7). Average RWSIs in the study area
were 0.51 in 1987 and 0.30 in 2000, which means that the water shortage in 1987
was more severe than that in 2000. Because the areas of unused land (saline–alkali
land and beach land) in 1987 were larger than those in 2000, the vegetation cover
was sparse, and the ET was stronger in 1987. As a consequence, the deficit of soil
water was relatively larger. Areas covered with saline–alkali land and low density
of grassland exhibited larger RWSI (Figure 7.7), both of which are mainly located in
the transition regions between urban and rural areas where the ET was salient. The
soil moisture in the coastal area covered with beach land and the inland area covered
with farmland yielded lower RWSI, implying relatively abundant water conditions.
Conversely, when the surface evaporation and transpiration are lower, the values
of LST become higher, and soil moisture contents become lower, moving the distribution of points (NDVI, LST) closer to the border of dry condition. Therefore,
according to the holistic pattern between LST and VIs in the context of the spatial
VITT, Sandholt et al. (2002) proposed the TVDI, which has been widely used in
(a)
(b)
N
0
5
10
20
km
Legend
RWSI in 1987
High: 1.43
Low: 0
N
0
5
10
20
km
Legend
RWSI in 2000
High: 1.46
Low: 0
FIGURE 7.7 RWSI maps in 1987 (a) and 2000 (b).
Multiscale Hydrologic Remote Sensing: Perspectives and Applications
7.3.2 Building a RelationShiP Between TVDI and
RWSI foR dRought iMPact aSSeSSMent
A clear pathway for drought impact assessment is found in a region where soil moisture changes from dry to wet as the land cover changes from bare soil to closed
vegetation (Figure 7.3). Such a change would make the LST data of all pixels form
a trapezoidal region in a two-dimensional plain (Moron et al. 1994). The borders
of this trapezoid in the LST–NDVI scatterplot (Figure 7.3) can be determined by
analyzing extreme soil conditions from bare soil and closed vegetation, to saturated
soil, and soil with minimum water content. Clearly, when surface evaporation and
transpiration are stronger, the values of LST become lower, and the soil moisture
content becomes higher, making the distribution of points (NDVI, LST) closer to the
border of wet conditions.
A summary of RWSI maps in 1987 and 2000 indicates that the larger the values
of RWSI, the higher the drought impact (Figure 7.7). Average RWSIs in the study area
were 0.51 in 1987 and 0.30 in 2000, which means that the water shortage in 1987
was more severe than that in 2000. Because the areas of unused land (saline–alkali
land and beach land) in 1987 were larger than those in 2000, the vegetation cover
was sparse, and the ET was stronger in 1987. As a consequence, the deficit of soil
water was relatively larger. Areas covered with saline–alkali land and low density
of grassland exhibited larger RWSI (Figure 7.7), both of which are mainly located in
the transition regions between urban and rural areas where the ET was salient. The
soil moisture in the coastal area covered with beach land and the inland area covered
with farmland yielded lower RWSI, implying relatively abundant water conditions.
Conversely, when the surface evaporation and transpiration are lower, the values
of LST become higher, and soil moisture contents become lower, moving the distribution of points (NDVI, LST) closer to the border of dry condition. Therefore,
according to the holistic pattern between LST and VIs in the context of the spatial
VITT, Sandholt et al. (2002) proposed the TVDI, which has been widely used in
(a)
(b)
N
0
5
10
20
km
Legend
RWSI in 1987
High: 1.43
Low: 0
N
0
5
10
20
km
Legend
RWSI in 2000
High: 1.46
Low: 0
FIGURE 7.7 RWSI maps in 1987 (a) and 2000 (b).