

153
Remote Sensing Drought Assessment in a Coastal Urban Region
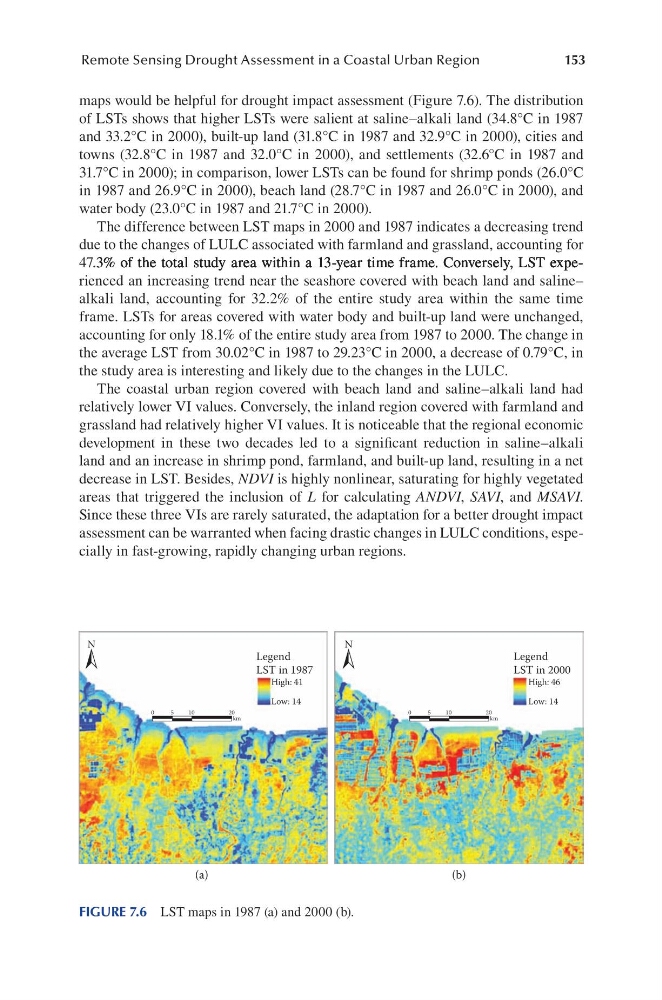
maps would be helpful for drought impact assessment (Figure 7.6). The distribution
of LSTs shows that higher LSTs were salient at saline–alkali land (34.8°C in 1987
and 33.2°C in 2000), built-up land (31.8°C in 1987 and 32.9°C in 2000), cities and
towns (32.8°C in 1987 and 32.0°C in 2000), and settlements (32.6°C in 1987 and
31.7°C in 2000); in comparison, lower LSTs can be found for shrimp ponds (26.0°C
in 1987 and 26.9°C in 2000), beach land (28.7°C in 1987 and 26.0°C in 2000), and
water body (23.0°C in 1987 and 21.7°C in 2000).
The difference between LST maps in 2000 and 1987 indicates a decreasing trend
due to the changes of LULC associated with farmland and grassland, accounting for
47.3% of the total study area within a 13-year time frame. Conversely, LST expe.3% of the total study area within a 13-year time frame. Conversely, LST expe3% of the total study area within a 13-year time frame. Conversely, LST expe% of the total study area within a 13-year time frame. Conversely, LST experienced an increasing trend near the seashore covered with beach land and saline–
alkali land, accounting for 32.2% of the entire study area within the same time
frame. LSTs for areas covered with water body and built-up land were unchanged,
accounting for only 18.1% of the entire study area from 1987 to 2000. The change in
the average LST from 30.02°C in 1987 to 29.23°C in 2000, a decrease of 0.79°C, in
the study area is interesting and likely due to the changes in the LULC.
The coastal urban region covered with beach land and saline–alkali land had
relatively lower VI values. Conversely, the inland region covered with farmland and
grassland had relatively higher VI values. It is noticeable that the regional economic
development in these two decades led to a significant reduction in saline–alkali
land and an increase in shrimp pond, farmland, and built-up land, resulting in a net
decrease in LST. Besides, NDVI is highly nonlinear, saturating for highly vegetated
areas that triggered the inclusion of L for calculating ANDVI, SAVI, and MSAVI.
Since these three VIs are rarely saturated, the adaptation for a better drought impact
assessment can be warranted when facing drastic changes in LULC conditions, especially in fast-growing, rapidly changing urban regions.
(a)
(b)
N
0
5
10
20
km
Legend
LST in 1987
High: 41
Low: 14
N
0
5
10
20
km
Legend
LST in 2000
High: 46
Low: 14
FIGURE 7.6 LST maps in 1987 (a) and 2000 (b).
Remote Sensing Drought Assessment in a Coastal Urban Region
maps would be helpful for drought impact assessment (Figure 7.6). The distribution
of LSTs shows that higher LSTs were salient at saline–alkali land (34.8°C in 1987
and 33.2°C in 2000), built-up land (31.8°C in 1987 and 32.9°C in 2000), cities and
towns (32.8°C in 1987 and 32.0°C in 2000), and settlements (32.6°C in 1987 and
31.7°C in 2000); in comparison, lower LSTs can be found for shrimp ponds (26.0°C
in 1987 and 26.9°C in 2000), beach land (28.7°C in 1987 and 26.0°C in 2000), and
water body (23.0°C in 1987 and 21.7°C in 2000).
The difference between LST maps in 2000 and 1987 indicates a decreasing trend
due to the changes of LULC associated with farmland and grassland, accounting for
47.3% of the total study area within a 13-year time frame. Conversely, LST expe.3% of the total study area within a 13-year time frame. Conversely, LST expe3% of the total study area within a 13-year time frame. Conversely, LST expe% of the total study area within a 13-year time frame. Conversely, LST experienced an increasing trend near the seashore covered with beach land and saline–
alkali land, accounting for 32.2% of the entire study area within the same time
frame. LSTs for areas covered with water body and built-up land were unchanged,
accounting for only 18.1% of the entire study area from 1987 to 2000. The change in
the average LST from 30.02°C in 1987 to 29.23°C in 2000, a decrease of 0.79°C, in
the study area is interesting and likely due to the changes in the LULC.
The coastal urban region covered with beach land and saline–alkali land had
relatively lower VI values. Conversely, the inland region covered with farmland and
grassland had relatively higher VI values. It is noticeable that the regional economic
development in these two decades led to a significant reduction in saline–alkali
land and an increase in shrimp pond, farmland, and built-up land, resulting in a net
decrease in LST. Besides, NDVI is highly nonlinear, saturating for highly vegetated
areas that triggered the inclusion of L for calculating ANDVI, SAVI, and MSAVI.
Since these three VIs are rarely saturated, the adaptation for a better drought impact
assessment can be warranted when facing drastic changes in LULC conditions, especially in fast-growing, rapidly changing urban regions.
(a)
(b)
N
0
5
10
20
km
Legend
LST in 1987
High: 41
Low: 14
N
0
5
10
20
km
Legend
LST in 2000
High: 46
Low: 14
FIGURE 7.6 LST maps in 1987 (a) and 2000 (b).