

152
Multiscale Hydrologic Remote Sensing: Perspectives and Applications
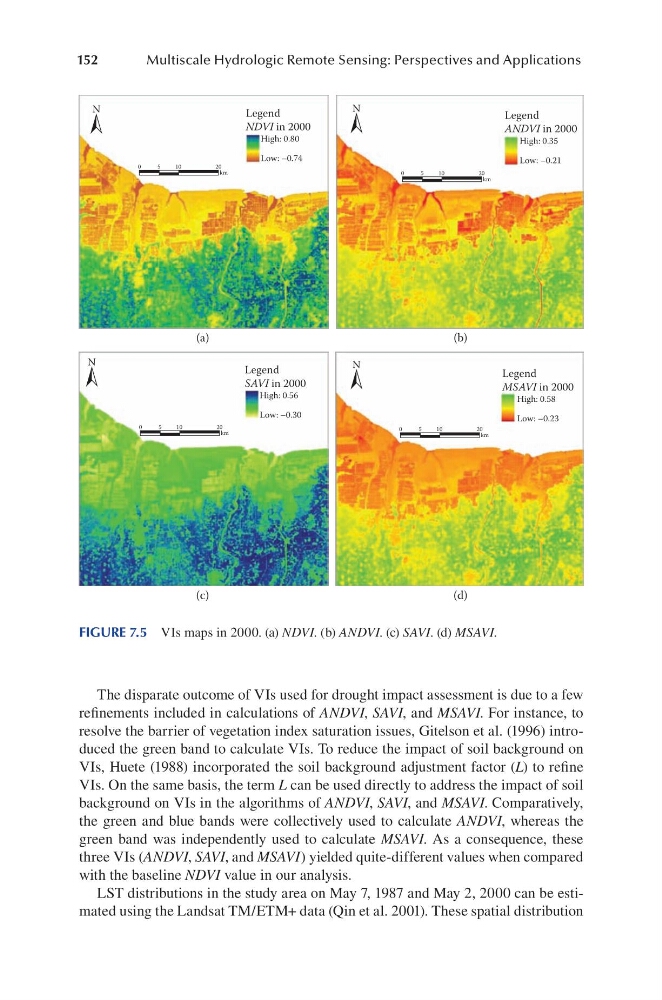
The disparate outcome of VIs used for drought impact assessment is due to a few
refinements included in calculations of ANDVI, SAVI, and MSAVI. For instance, to
resolve the barrier of vegetation index saturation issues, Gitelson et al. (1996) introduced the green band to calculate VIs. To reduce the impact of soil background on
VIs, Huete (1988) incorporated the soil background adjustment factor (L) to refine
VIs. On the same basis, the term L can be used directly to address the impact of soil
background on VIs in the algorithms of ANDVI, SAVI, and MSAVI. Comparatively,
the green and blue bands were collectively used to calculate ANDVI, whereas the
green band was independently used to calculate MSAVI. As a consequence, these
three VIs (ANDVI, SAVI, and MSAVI) yielded quite-different values when compared
with the baseline NDVI value in our analysis.
LST distributions in the study area on May 7, 1987 and May 2, 2000 can be estimated using the Landsat TM/ETM+ data (Qin et al. 2001). These spatial distribution
(a)
(b)
(c)
(d)
N
N
N
N
0
5
10
20
km
0
5
10
20
km
0
5
10
20
km
0
5
10
20
km
Legend
NDVI in 2000
High: 0.80
Low: –0.74
Legend
ANDVI in 2000
High: 0.35
Low: –0.21
Legend
MSAVI in 2000
High: 0.58
Low: –0.23
Legend
SAVI in 2000
High: 0.56
Low: –0.30
FIGURE 7.5 VIs maps in 2000. (a) NDVI. (b) ANDVI. (c) SAVI. (d) MSAVI.
Multiscale Hydrologic Remote Sensing: Perspectives and Applications
The disparate outcome of VIs used for drought impact assessment is due to a few
refinements included in calculations of ANDVI, SAVI, and MSAVI. For instance, to
resolve the barrier of vegetation index saturation issues, Gitelson et al. (1996) introduced the green band to calculate VIs. To reduce the impact of soil background on
VIs, Huete (1988) incorporated the soil background adjustment factor (L) to refine
VIs. On the same basis, the term L can be used directly to address the impact of soil
background on VIs in the algorithms of ANDVI, SAVI, and MSAVI. Comparatively,
the green and blue bands were collectively used to calculate ANDVI, whereas the
green band was independently used to calculate MSAVI. As a consequence, these
three VIs (ANDVI, SAVI, and MSAVI) yielded quite-different values when compared
with the baseline NDVI value in our analysis.
LST distributions in the study area on May 7, 1987 and May 2, 2000 can be estimated using the Landsat TM/ETM+ data (Qin et al. 2001). These spatial distribution
(a)
(b)
(c)
(d)
N
N
N
N
0
5
10
20
km
0
5
10
20
km
0
5
10
20
km
0
5
10
20
km
Legend
NDVI in 2000
High: 0.80
Low: –0.74
Legend
ANDVI in 2000
High: 0.35
Low: –0.21
Legend
MSAVI in 2000
High: 0.58
Low: –0.23
Legend
SAVI in 2000
High: 0.56
Low: –0.30
FIGURE 7.5 VIs maps in 2000. (a) NDVI. (b) ANDVI. (c) SAVI. (d) MSAVI.