

151
Remote Sensing Drought Assessment in a Coastal Urban Region
residential areas, and other constructed land) and beach land accounted for 11% and
6% of the total area, respectively. Thus, four major types of land cover, including
farmland, saline–alkali land, built-up land, and water body, accounted for 92% of
the total study area in 2000.
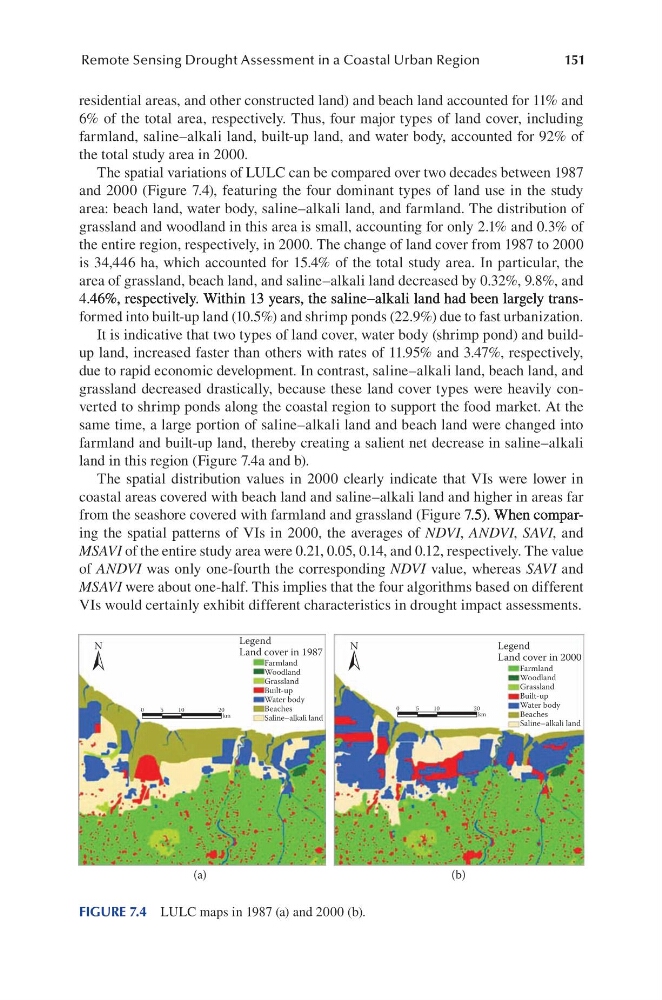
The spatial variations of LULC can be compared over two decades between 1987
and 2000 (Figure 7.4), featuring the four dominant types of land use in the study
area: beach land, water body, saline–alkali land, and farmland. The distribution of
grassland and woodland in this area is small, accounting for only 2.1% and 0.3% of
the entire region, respectively, in 2000. The change of land cover from 1987 to 2000
is 34,446 ha, which accounted for 15.4% of the total study area. In particular, the
area of grassland, beach land, and saline–alkali land decreased by 0.32%, 9.8%, and
4.46%, respectively. Within 13 years, the saline–alkali land had been largely trans.46%, respectively. Within 13 years, the saline–alkali land had been largely trans46%, respectively. Within 13 years, the saline–alkali land had been largely trans%, respectively. Within 13 years, the saline–alkali land had been largely transformed into built-up land (10.5%) and shrimp ponds (22.9%) due to fast urbanization.
It is indicative that two types of land cover, water body (shrimp pond) and buildup land, increased faster than others with rates of 11.95% and 3.47%, respectively,
due to rapid economic development. In contrast, saline–alkali land, beach land, and
grassland decreased drastically, because these land cover types were heavily converted to shrimp ponds along the coastal region to support the food market. At the
same time, a large portion of saline–alkali land and beach land were changed into
farmland and built-up land, thereby creating a salient net decrease in saline–alkali
land in this region (Figure 7.4a and b).
The spatial distribution values in 2000 clearly indicate that VIs were lower in
coastal areas covered with beach land and saline–alkali land and higher in areas far
from the seashore covered with farmland and grassland (Figure 7.5). When compar7.5). When compar.5). When compar5). When comparing the spatial patterns of VIs in 2000, the averages of NDVI, ANDVI, SAVI, and
MSAVI of the entire study area were 0.21, 0.05, 0.14, and 0.12, respectively. The value
of ANDVI was only one-fourth the corresponding NDVI value, whereas SAVI and
MSAVI were about one-half. This implies that the four algorithms based on different
VIs would certainly exhibit different characteristics in drought impact assessments.
(a)
(b)
Legend
Land cover in 1987
N
Farmland
Woodland
Grassland
Built-up
Water body
Beaches
Saline–alkali land
Legend
Land cover in 2000
Farmland
Woodland
Grassland
Built-up
Water body
Beaches
Saline–alkali land
N
0
5
10
20
km
0
5
10
20
km
FIGURE 7.4 LULC maps in 1987 (a) and 2000 (b).
Remote Sensing Drought Assessment in a Coastal Urban Region
residential areas, and other constructed land) and beach land accounted for 11% and
6% of the total area, respectively. Thus, four major types of land cover, including
farmland, saline–alkali land, built-up land, and water body, accounted for 92% of
the total study area in 2000.
The spatial variations of LULC can be compared over two decades between 1987
and 2000 (Figure 7.4), featuring the four dominant types of land use in the study
area: beach land, water body, saline–alkali land, and farmland. The distribution of
grassland and woodland in this area is small, accounting for only 2.1% and 0.3% of
the entire region, respectively, in 2000. The change of land cover from 1987 to 2000
is 34,446 ha, which accounted for 15.4% of the total study area. In particular, the
area of grassland, beach land, and saline–alkali land decreased by 0.32%, 9.8%, and
4.46%, respectively. Within 13 years, the saline–alkali land had been largely trans.46%, respectively. Within 13 years, the saline–alkali land had been largely trans46%, respectively. Within 13 years, the saline–alkali land had been largely trans%, respectively. Within 13 years, the saline–alkali land had been largely transformed into built-up land (10.5%) and shrimp ponds (22.9%) due to fast urbanization.
It is indicative that two types of land cover, water body (shrimp pond) and buildup land, increased faster than others with rates of 11.95% and 3.47%, respectively,
due to rapid economic development. In contrast, saline–alkali land, beach land, and
grassland decreased drastically, because these land cover types were heavily converted to shrimp ponds along the coastal region to support the food market. At the
same time, a large portion of saline–alkali land and beach land were changed into
farmland and built-up land, thereby creating a salient net decrease in saline–alkali
land in this region (Figure 7.4a and b).
The spatial distribution values in 2000 clearly indicate that VIs were lower in
coastal areas covered with beach land and saline–alkali land and higher in areas far
from the seashore covered with farmland and grassland (Figure 7.5). When compar7.5). When compar.5). When compar5). When comparing the spatial patterns of VIs in 2000, the averages of NDVI, ANDVI, SAVI, and
MSAVI of the entire study area were 0.21, 0.05, 0.14, and 0.12, respectively. The value
of ANDVI was only one-fourth the corresponding NDVI value, whereas SAVI and
MSAVI were about one-half. This implies that the four algorithms based on different
VIs would certainly exhibit different characteristics in drought impact assessments.
(a)
(b)
Legend
Land cover in 1987
N
Farmland
Woodland
Grassland
Built-up
Water body
Beaches
Saline–alkali land
Legend
Land cover in 2000
Farmland
Woodland
Grassland
Built-up
Water body
Beaches
Saline–alkali land
N
0
5
10
20
km
0
5
10
20
km
FIGURE 7.4 LULC maps in 1987 (a) and 2000 (b).