

150
Multiscale Hydrologic Remote Sensing: Perspectives and Applications
Thus, Equation 7.15 becomes
TVDI
Ts a b
VI
a b VI
a b VI
=
−
+ ×
+ ×
−
+ ×
∫
2
2
1
1
2
2
(
) (
)
.
(7.18)
Based on the parameters of LULC, VIs, LST, RWSI, and TVDIs generated with
the above algorithms, the spatial patterns of LULC, VIs, and LST and their interrelationships can be analyzed with respect to five RWSI classification categories for
assessing the regional drought events. This endeavor would enable us to derive the
linkages between the RWSI and the TVDIs and therefore help identify the possible
adaptation and application potentials of theses four types of VIs (i.e., NDVI, ANDVI,
SAVI, and MSAVI) proposed for monitoring the regional drought, as described in the
next section. This study followed Equations 7.15 and 7.18 for the derivation of TVDIs
(TVDI_NDVI, TVDI_ANDVI, TVDI_SAVI, and TVDI_MSAVI).
7.3 RESULTS OF SPATIAL ANALYSIS FOR DROUGHT ASSESSMENT
7.3.1 SPatial PatteRnS of lulc, viS, and lSt
Landsat TM data were used for the analysis of LULC. With the aid of ground-truth
data throughout the calibration and validation stages, LULC can be classified into
seven categories, including farmland, grassland, woodland, water bodies, beach
land, buildup land, and saline–alkali land. In 2000, the farmland accounted for 46%
of the total area, followed by water body and the saline–alkali land, which accounted
for 23% and 12% of the total area, respectively. In addition, built-up land (cities, rural
Dry bare soil
Dry border
Vegetation canopy
(water stress)
Vegetation canopy
(adequate moisture)
Saturated
bare soil
0.0
1.0
Normalized difference vegetation index
Land surface
temperature
T max
T min
Wet border
“Wet” point
“Dry” point
Dry
Wet
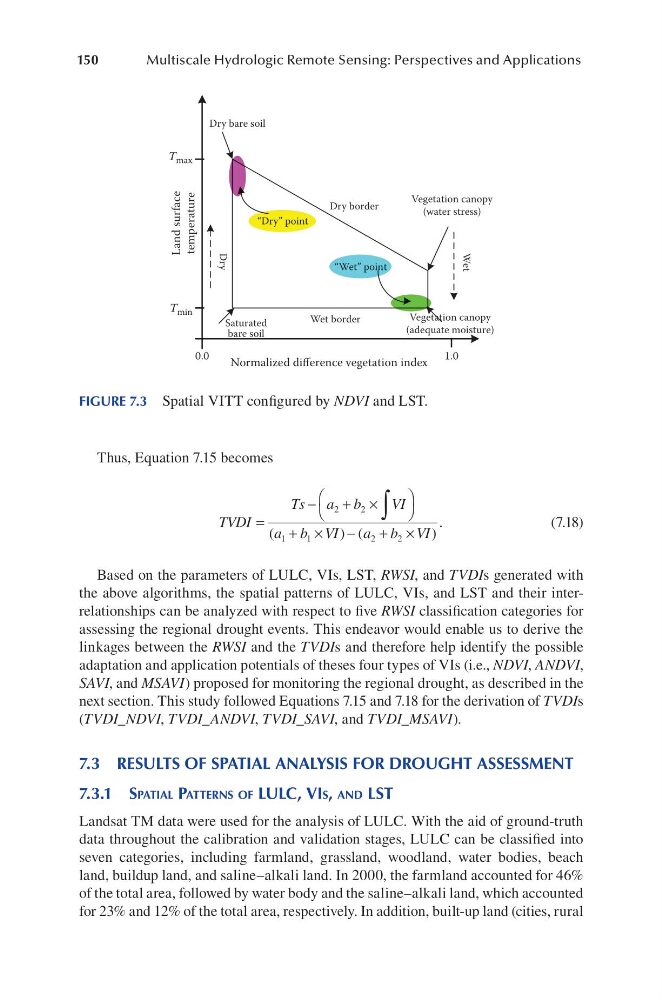
FIGURE 7.3 Spatial VITT configured by NDVI and LST.
Multiscale Hydrologic Remote Sensing: Perspectives and Applications
Thus, Equation 7.15 becomes
TVDI
Ts a b
VI
a b VI
a b VI
=
−
+ ×
+ ×
−
+ ×
∫
2
2
1
1
2
2
(
) (
)
.
(7.18)
Based on the parameters of LULC, VIs, LST, RWSI, and TVDIs generated with
the above algorithms, the spatial patterns of LULC, VIs, and LST and their interrelationships can be analyzed with respect to five RWSI classification categories for
assessing the regional drought events. This endeavor would enable us to derive the
linkages between the RWSI and the TVDIs and therefore help identify the possible
adaptation and application potentials of theses four types of VIs (i.e., NDVI, ANDVI,
SAVI, and MSAVI) proposed for monitoring the regional drought, as described in the
next section. This study followed Equations 7.15 and 7.18 for the derivation of TVDIs
(TVDI_NDVI, TVDI_ANDVI, TVDI_SAVI, and TVDI_MSAVI).
7.3 RESULTS OF SPATIAL ANALYSIS FOR DROUGHT ASSESSMENT
7.3.1 SPatial PatteRnS of lulc, viS, and lSt
Landsat TM data were used for the analysis of LULC. With the aid of ground-truth
data throughout the calibration and validation stages, LULC can be classified into
seven categories, including farmland, grassland, woodland, water bodies, beach
land, buildup land, and saline–alkali land. In 2000, the farmland accounted for 46%
of the total area, followed by water body and the saline–alkali land, which accounted
for 23% and 12% of the total area, respectively. In addition, built-up land (cities, rural
Dry bare soil
Dry border
Vegetation canopy
(water stress)
Vegetation canopy
(adequate moisture)
Saturated
bare soil
0.0
1.0
Normalized difference vegetation index
Land surface
temperature
T max
T min
Wet border
“Wet” point
“Dry” point
Dry
Wet
FIGURE 7.3 Spatial VITT configured by NDVI and LST.