

149
Remote Sensing Drought Assessment in a Coastal Urban Region
where ET is the regional actual ET (in cubic meters per hectare per day), and ET wet
is the regional potential ET (in per cubic meter per hectare per day). Potential ET is
the maximum ET under ideal water conditions, assuming that the sensible heat flux
is minimum (H ≈ 0), and all effective energy received by the land surface is used for
ET. This amount of energy is λET wet = R n – G. If the energy balance equation can be
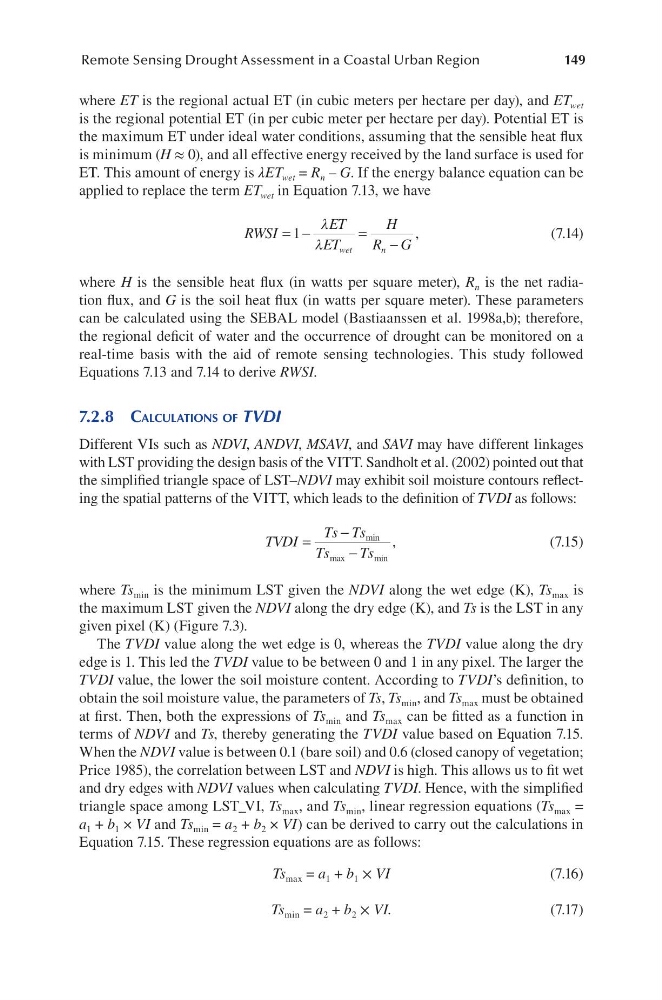
applied to replace the term ET wet in Equation 7.13, we have
RWSI
ET
ET
H
R G
wet
n
= −
=
−
1
λ
λ
,
(7.14)
where H is the sensible heat flux (in watts per square meter), R n is the net radiation flux, and G is the soil heat flux (in watts per square meter). These parameters
can be calculated using the SEBAL model (Bastiaanssen et al. 1998a,b); therefore,
the regional deficit of water and the occurrence of drought can be monitored on a
real-time basis with the aid of remote sensing technologies. This study followed
Equations 7.13 and 7.14 to derive RWSI.
7.2.8 calculationS of TVDI
Different VIs such as NDVI, ANDVI, MSAVI, and SAVI may have different linkages
with LST providing the design basis of the VITT. Sandholt et al. (2002) pointed out that
the simplified triangle space of LST–NDVI may exhibit soil moisture contours reflecting the spatial patterns of the VITT, which leads to the definition of TVDI as follows:
TVDI
Ts Ts
Ts
Ts
=
−
−
min
max
min
,
(7.15)
where Ts min is the minimum LST given the NDVI along the wet edge (K), Ts max is
the maximum LST given the NDVI along the dry edge (K), and Ts is the LST in any
given pixel (K) (Figure 7.3).
The TVDI value along the wet edge is 0, whereas the TVDI value along the dry
edge is 1. This led the TVDI value to be between 0 and 1 in any pixel. The larger the
TVDI value, the lower the soil moisture content. According to TVDI’s definition, to
obtain the soil moisture value, the parameters of Ts, Ts min , and Ts max must be obtained
at first. Then, both the expressions of Ts min and Ts max can be fitted as a function in
terms of NDVI and Ts, thereby generating the TVDI value based on Equation 7.15.
When the NDVI value is between 0.1 (bare soil) and 0.6 (closed canopy of vegetation;
Price 1985), the correlation between LST and NDVI is high. This allows us to fit wet
and dry edges with NDVI values when calculating TVDI. Hence, with the simplified
triangle space among LST_VI, Ts max , and Ts min , linear regression equations (Ts max =
a 1 + b 1 × VI and Ts min = a 2 + b 2 × VI) can be derived to carry out the calculations in
Equation 7.15. These regression equations are as follows:
Ts max = a 1 + b 1 × VI
(7.16)
Ts min = a 2 + b 2 × VI.
(7.17)
Remote Sensing Drought Assessment in a Coastal Urban Region
where ET is the regional actual ET (in cubic meters per hectare per day), and ET wet
is the regional potential ET (in per cubic meter per hectare per day). Potential ET is
the maximum ET under ideal water conditions, assuming that the sensible heat flux
is minimum (H ≈ 0), and all effective energy received by the land surface is used for
ET. This amount of energy is λET wet = R n – G. If the energy balance equation can be
applied to replace the term ET wet in Equation 7.13, we have
RWSI
ET
ET
H
R G
wet
n
= −
=
−
1
λ
λ
,
(7.14)
where H is the sensible heat flux (in watts per square meter), R n is the net radiation flux, and G is the soil heat flux (in watts per square meter). These parameters
can be calculated using the SEBAL model (Bastiaanssen et al. 1998a,b); therefore,
the regional deficit of water and the occurrence of drought can be monitored on a
real-time basis with the aid of remote sensing technologies. This study followed
Equations 7.13 and 7.14 to derive RWSI.
7.2.8 calculationS of TVDI
Different VIs such as NDVI, ANDVI, MSAVI, and SAVI may have different linkages
with LST providing the design basis of the VITT. Sandholt et al. (2002) pointed out that
the simplified triangle space of LST–NDVI may exhibit soil moisture contours reflecting the spatial patterns of the VITT, which leads to the definition of TVDI as follows:
TVDI
Ts Ts
Ts
Ts
=
−
−
min
max
min
,
(7.15)
where Ts min is the minimum LST given the NDVI along the wet edge (K), Ts max is
the maximum LST given the NDVI along the dry edge (K), and Ts is the LST in any
given pixel (K) (Figure 7.3).
The TVDI value along the wet edge is 0, whereas the TVDI value along the dry
edge is 1. This led the TVDI value to be between 0 and 1 in any pixel. The larger the
TVDI value, the lower the soil moisture content. According to TVDI’s definition, to
obtain the soil moisture value, the parameters of Ts, Ts min , and Ts max must be obtained
at first. Then, both the expressions of Ts min and Ts max can be fitted as a function in
terms of NDVI and Ts, thereby generating the TVDI value based on Equation 7.15.
When the NDVI value is between 0.1 (bare soil) and 0.6 (closed canopy of vegetation;
Price 1985), the correlation between LST and NDVI is high. This allows us to fit wet
and dry edges with NDVI values when calculating TVDI. Hence, with the simplified
triangle space among LST_VI, Ts max , and Ts min , linear regression equations (Ts max =
a 1 + b 1 × VI and Ts min = a 2 + b 2 × VI) can be derived to carry out the calculations in
Equation 7.15. These regression equations are as follows:
Ts max = a 1 + b 1 × VI
(7.16)
Ts min = a 2 + b 2 × VI.
(7.17)