

94
Multiscale Hydrologic Remote Sensing: Perspectives and Applications
9 kg of mass represents 1 mm of water depth equivalence. The data from the
lysimeters will be used to compare and evaluate the EC measurements of ET, but
at the time of publishing this chapter, the lysimeter data analysis was not fully
completed.
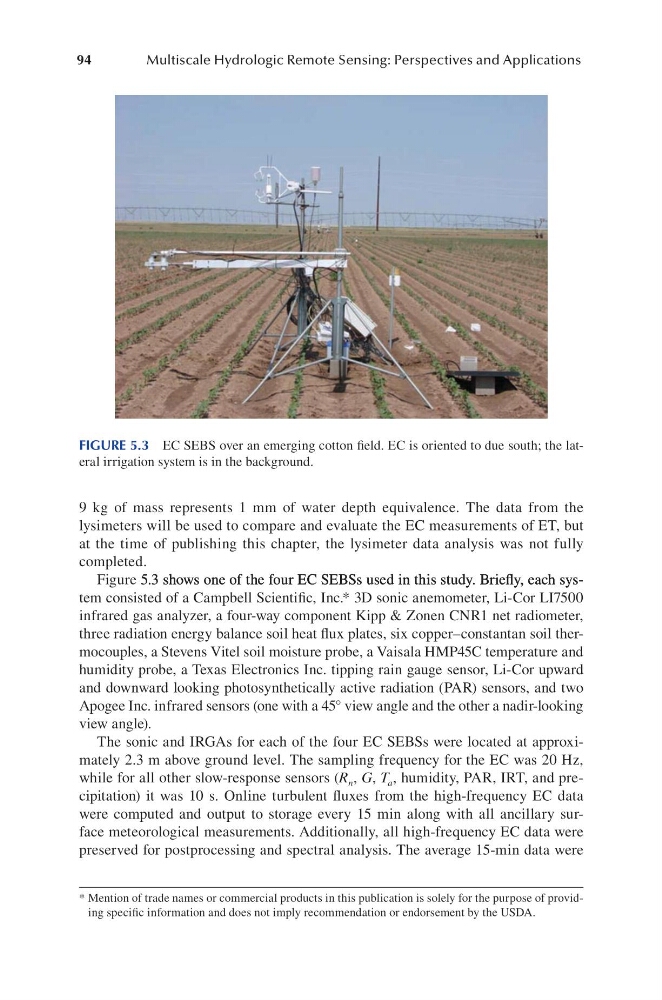
Figure 5.3 shows one of the four EC SEBSs used in this study. Briefl y, each sys5.3 shows one of the four EC SEBSs used in this study. Briefl y, each sys.3 shows one of the four EC SEBSs used in this study. Briefly, each system consisted of a Campbell Scientific, Inc.* 3D sonic anemometer, Li-Cor LI7500
infrared gas analyzer, a four-way component Kipp & Zonen CNR1 net radiometer,
three radiation energy balance soil heat flux plates, six copper–constantan soil thermocouples, a Stevens Vitel soil moisture probe, a Vaisala HMP45C temperature and
humidity probe, a Texas Electronics Inc. tipping rain gauge sensor, Li-Cor upward
and downward looking photosynthetically active radiation (PAR) sensors, and two
Apogee Inc. infrared sensors (one with a 45° view angle and the other a nadir-looking
view angle).
The sonic and IRGAs for each of the four EC SEBSs were located at approximately 2.3 m above ground level. The sampling frequency for the EC was 20 Hz,
while for all other slow-response sensors (R n , G, T a , humidity, PAR, IRT, and precipitation) it was 10 s. Online turbulent fluxes from the high-frequency EC data
were computed and output to storage every 15 min along with all ancillary surface meteorological measurements. Additionally, all high-frequency EC data were
preserved for postprocessing and spectral analysis. The average 15-min data were
* Mention of trade names or commercial products in this publication is solely for the purpose of providing specific information and does not imply recommendation or endorsement by the USDA.
FIGURE 5.3 EC SEBS over an emerging cotton field. EC is oriented to due south; the lateral irrigation system is in the background.
Multiscale Hydrologic Remote Sensing: Perspectives and Applications
9 kg of mass represents 1 mm of water depth equivalence. The data from the
lysimeters will be used to compare and evaluate the EC measurements of ET, but
at the time of publishing this chapter, the lysimeter data analysis was not fully
completed.
Figure 5.3 shows one of the four EC SEBSs used in this study. Briefl y, each sys5.3 shows one of the four EC SEBSs used in this study. Briefl y, each sys.3 shows one of the four EC SEBSs used in this study. Briefly, each system consisted of a Campbell Scientific, Inc.* 3D sonic anemometer, Li-Cor LI7500
infrared gas analyzer, a four-way component Kipp & Zonen CNR1 net radiometer,
three radiation energy balance soil heat flux plates, six copper–constantan soil thermocouples, a Stevens Vitel soil moisture probe, a Vaisala HMP45C temperature and
humidity probe, a Texas Electronics Inc. tipping rain gauge sensor, Li-Cor upward
and downward looking photosynthetically active radiation (PAR) sensors, and two
Apogee Inc. infrared sensors (one with a 45° view angle and the other a nadir-looking
view angle).
The sonic and IRGAs for each of the four EC SEBSs were located at approximately 2.3 m above ground level. The sampling frequency for the EC was 20 Hz,
while for all other slow-response sensors (R n , G, T a , humidity, PAR, IRT, and precipitation) it was 10 s. Online turbulent fluxes from the high-frequency EC data
were computed and output to storage every 15 min along with all ancillary surface meteorological measurements. Additionally, all high-frequency EC data were
preserved for postprocessing and spectral analysis. The average 15-min data were
* Mention of trade names or commercial products in this publication is solely for the purpose of providing specific information and does not imply recommendation or endorsement by the USDA.
FIGURE 5.3 EC SEBS over an emerging cotton field. EC is oriented to due south; the lateral irrigation system is in the background.