

92
Multiscale Hydrologic Remote Sensing: Perspectives and Applications
humidity (dimensionless); L v is the latent heat of vaporization (in joules per kilogram);
w is the vertical wind velocity (m s –1 ); T is the temperature (°C); primes represent
instantaneous fluctuations; and overbars represent a time average. Equations 5.4 and 5.5
serve as the fundamental expressions to the turbulent flux exchange over most surfaces.
Determining the appropriate interpretation for EC measurements so that they represent the flux density of scalars and mass exchanged between the boundary layer and
the underlying surface is a contemporary challenge to micrometeorologists (Foken
and Wichura 1996). On the one hand, the challenge is to be able to assess the level
of accuracy for EC measurements for H and LE so that water management issues are
adequately provided for but with respect to remote sensing validation. On the other
hand, the EC estimates of H and LE need to be valid and accurate representations
of the surface state conditions in order to serve as validation points for regional ET
estimates using remote sensing techniques.
5.3 SITE DESCRIPTION AND INSTRUMENTATION
The study was conducted at the United States Department of Agriculture Agricultural
Research Service (USDA-ARS) Conservation and Production Research Laboratory
(CPRL) in Bushland, TX, during the summer of 2008. The geographic coordinates
of the CPRL are 35°11′N, 102°06′W, and its elevation is 1170 m above mean sea
level. This facility is dedicated to research, providing technology for sustainable
agricultural production systems in harsh semiarid environments. A critical focus of
this facility is to conduct basic research to improve productivity and water use efficiency in irrigated and dryland cropping systems representing the southwestern US.
This study was part of a multi-institutional research effort involving scientists and
engineers from universities and state and federal research agencies. The location of
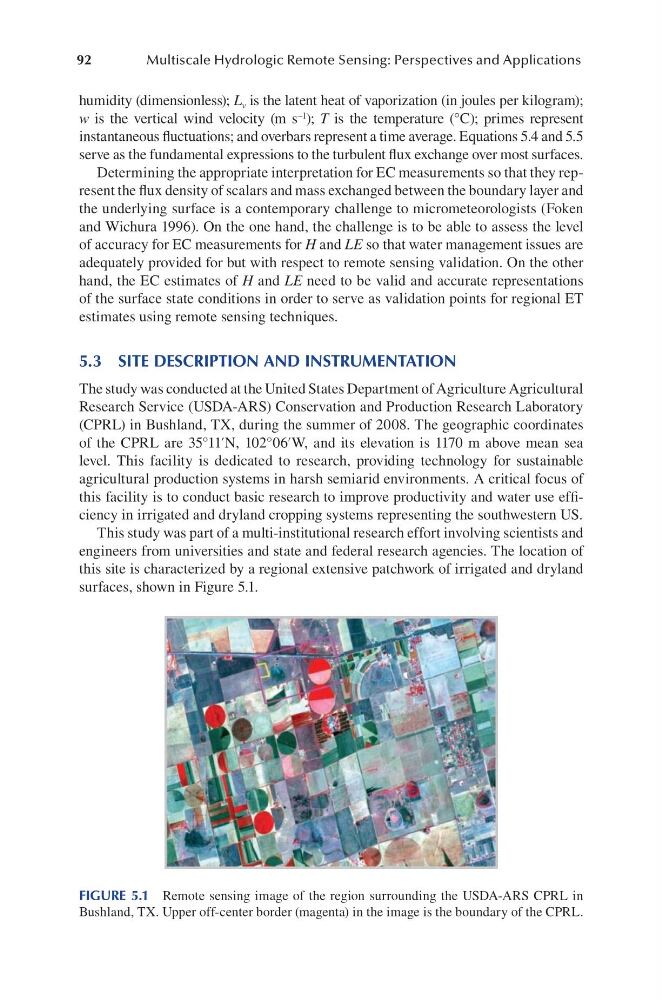
this site is characterized by a regional extensive patchwork of irrigated and dryland
surfaces, shown in Figure 5.1.
FIGURE 5.1 Remote sensing image of the region surrounding the USDA-ARS CPRL in
Bushland, TX. Upper off-center border (magenta) in the image is the boundary of the CPRL.
Multiscale Hydrologic Remote Sensing: Perspectives and Applications
humidity (dimensionless); L v is the latent heat of vaporization (in joules per kilogram);
w is the vertical wind velocity (m s –1 ); T is the temperature (°C); primes represent
instantaneous fluctuations; and overbars represent a time average. Equations 5.4 and 5.5
serve as the fundamental expressions to the turbulent flux exchange over most surfaces.
Determining the appropriate interpretation for EC measurements so that they represent the flux density of scalars and mass exchanged between the boundary layer and
the underlying surface is a contemporary challenge to micrometeorologists (Foken
and Wichura 1996). On the one hand, the challenge is to be able to assess the level
of accuracy for EC measurements for H and LE so that water management issues are
adequately provided for but with respect to remote sensing validation. On the other
hand, the EC estimates of H and LE need to be valid and accurate representations
of the surface state conditions in order to serve as validation points for regional ET
estimates using remote sensing techniques.
5.3 SITE DESCRIPTION AND INSTRUMENTATION
The study was conducted at the United States Department of Agriculture Agricultural
Research Service (USDA-ARS) Conservation and Production Research Laboratory
(CPRL) in Bushland, TX, during the summer of 2008. The geographic coordinates
of the CPRL are 35°11′N, 102°06′W, and its elevation is 1170 m above mean sea
level. This facility is dedicated to research, providing technology for sustainable
agricultural production systems in harsh semiarid environments. A critical focus of
this facility is to conduct basic research to improve productivity and water use efficiency in irrigated and dryland cropping systems representing the southwestern US.
This study was part of a multi-institutional research effort involving scientists and
engineers from universities and state and federal research agencies. The location of
this site is characterized by a regional extensive patchwork of irrigated and dryland
surfaces, shown in Figure 5.1.
FIGURE 5.1 Remote sensing image of the region surrounding the USDA-ARS CPRL in
Bushland, TX. Upper off-center border (magenta) in the image is the boundary of the CPRL.