

91
Thermal Radiation and Energy Closure Assessment
terms are identified as u, v, and w (streamwise, lateral, and vertical) directions. IRGAs
that are specific to water vapor (ρ v ) and, more recently, CO 2 absorption are also fastresponse measurements capable of sampling at the same rate as the sonic measurements
of the velocity components. When appropriately used together over most types of vegetated surfaces, sonic anemometers and IRGAs provide high-frequency measurements
(typically between 10 and 20 Hz) of vertical wind velocity, mass, and scalar concentrations of state variables that represent critical exchange processes (ρ v , CO 2 , heat, and
momentum) between a surface and the boundary layer of the atmosphere that is in
direct contact and influenced by the surface. These fast-response measurements of state
variables result in time series data statistically analyzed into the commonly known EC.
The term covariance is a well-established statistical function representing an estimate of the variation between two variables and can be either positive or negative.
The variables need not be specified as dependent and independent. EC is the most
physically direct method for measuring heat and mass fluxes between a surface and
the atmosphere (Baldocchi et al. 1988). For vertical fluxes of scalars and momentum,
fast-response sensors measure the fluctuating components of w (vertical velocity)
that transport other entities such as ρ v , T, u, v, and CO 2 that can then be used to
compute vertical, latent, and sensible heat fluxes as well as momentum components
of the turbulent flow field. Other horizontal covariances can also be computed, but
for this chapter, we confined ourselves to the vertical plane. EC instruments are well
suited for continuous long-term monitoring of field-scale processes that include heat,
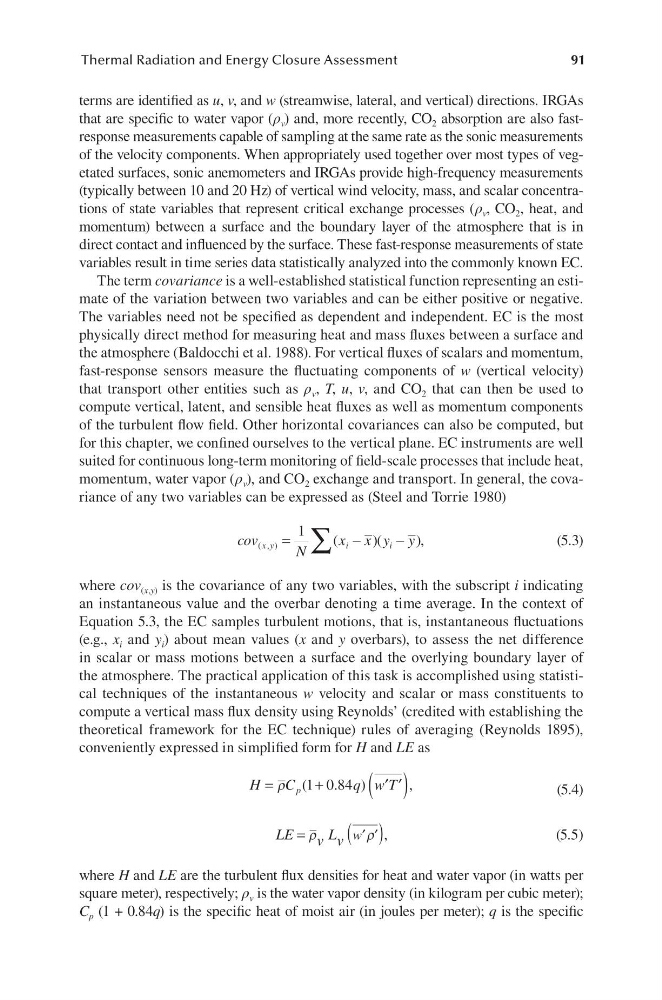
momentum, water vapor (ρ v ), and CO 2 exchange and transport. In general, the covariance of any two variables can be expressed as (Steel and Torrie 1980)
cov ( , )
(
)(
),
x y
i
i
N
x x y y
=
−
−
∑
1
(5.3)
where cov (x,y) is the covariance of any two variables, with the subscript i indicating
an instantaneous value and the overbar denoting a time average. In the context of
Equation 5.3, the EC samples turbulent motions, that is, instantaneous fluctuations
(e.g., x i and y i ) about mean values (x and y overbars), to assess the net difference
in scalar or mass motions between a surface and the overlying boundary layer of
the atmosphere. The practical application of this task is accomplished using statistical techniques of the instantaneous w velocity and scalar or mass constituents to
compute a vertical mass flux density using Reynolds’ (credited with establishing the
theoretical framework for the EC technique) rules of averaging (Reynolds 1895),
conveniently expressed in simplified form for H and LE as
H
C
q w T
p
=
+
′ ′
( )
ρ (
.
)
,
1 0 84
(5.4)
LE
v L v w
=
′ ′
( )
ρ
ρ ,
(5.5)
where H and LE are the turbulent flux densities for heat and water vapor (in watts per
square meter), respectively; ρ v is the water vapor density (in kilogram per cubic meter);
C p (1 + 0.84q) is the specific heat of moist air (in joules per meter); q is the specific
Thermal Radiation and Energy Closure Assessment
terms are identified as u, v, and w (streamwise, lateral, and vertical) directions. IRGAs
that are specific to water vapor (ρ v ) and, more recently, CO 2 absorption are also fastresponse measurements capable of sampling at the same rate as the sonic measurements
of the velocity components. When appropriately used together over most types of vegetated surfaces, sonic anemometers and IRGAs provide high-frequency measurements
(typically between 10 and 20 Hz) of vertical wind velocity, mass, and scalar concentrations of state variables that represent critical exchange processes (ρ v , CO 2 , heat, and
momentum) between a surface and the boundary layer of the atmosphere that is in
direct contact and influenced by the surface. These fast-response measurements of state
variables result in time series data statistically analyzed into the commonly known EC.
The term covariance is a well-established statistical function representing an estimate of the variation between two variables and can be either positive or negative.
The variables need not be specified as dependent and independent. EC is the most
physically direct method for measuring heat and mass fluxes between a surface and
the atmosphere (Baldocchi et al. 1988). For vertical fluxes of scalars and momentum,
fast-response sensors measure the fluctuating components of w (vertical velocity)
that transport other entities such as ρ v , T, u, v, and CO 2 that can then be used to
compute vertical, latent, and sensible heat fluxes as well as momentum components
of the turbulent flow field. Other horizontal covariances can also be computed, but
for this chapter, we confined ourselves to the vertical plane. EC instruments are well
suited for continuous long-term monitoring of field-scale processes that include heat,
momentum, water vapor (ρ v ), and CO 2 exchange and transport. In general, the covariance of any two variables can be expressed as (Steel and Torrie 1980)
cov ( , )
(
)(
),
x y
i
i
N
x x y y
=
−
−
∑
1
(5.3)
where cov (x,y) is the covariance of any two variables, with the subscript i indicating
an instantaneous value and the overbar denoting a time average. In the context of
Equation 5.3, the EC samples turbulent motions, that is, instantaneous fluctuations
(e.g., x i and y i ) about mean values (x and y overbars), to assess the net difference
in scalar or mass motions between a surface and the overlying boundary layer of
the atmosphere. The practical application of this task is accomplished using statistical techniques of the instantaneous w velocity and scalar or mass constituents to
compute a vertical mass flux density using Reynolds’ (credited with establishing the
theoretical framework for the EC technique) rules of averaging (Reynolds 1895),
conveniently expressed in simplified form for H and LE as
H
C
q w T
p
=
+
′ ′
( )
ρ (
.
)
,
1 0 84
(5.4)
LE
v L v w
=
′ ′
( )
ρ
ρ ,
(5.5)
where H and LE are the turbulent flux densities for heat and water vapor (in watts per
square meter), respectively; ρ v is the water vapor density (in kilogram per cubic meter);
C p (1 + 0.84q) is the specific heat of moist air (in joules per meter); q is the specific