

broad climatic variation and note western and
central regions tend to have frequent fires with
forest stand structures dominated by younger
trees, whereas the eastern region experiences
longer inter-fire intervals and older stand
structures. A statistical forecast methodology
developed by Westerling et al. (2002) exploits
these gradients to predict area burned in western
U.S. wildfires by ecoregion a season in advance.
Littell et al. (2009) found that climate drivers
of synchronous fire differ regionally. They
identified four distinct geographic patterns of
ecoregion provinces (ecoprovinces) across the
West, and each ecoprovince had its own unique
set of climate drivers that affect annual area
burned by wildfire. For example, in northern
mountain ecoprovinces dry, warm conditions
during the seasons leading up to and including
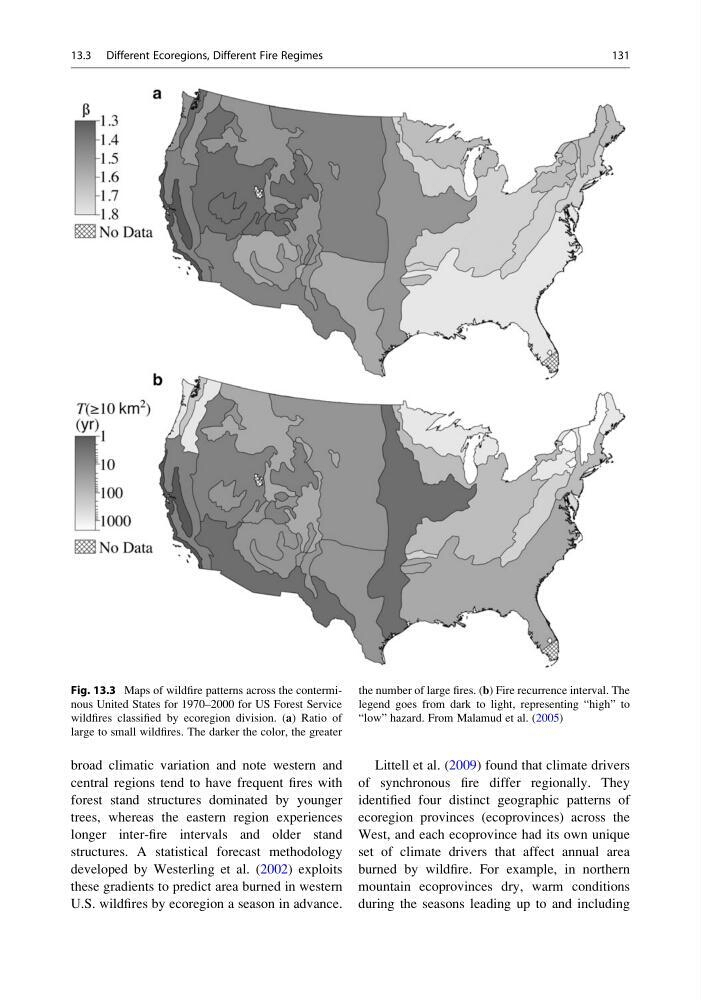
Fig. 13.3 Maps of wildfire patterns across the conterminous United States for 1970–2000 for US Forest Service
wildfires classified by ecoregion division. (a) Ratio of
large to small wildfires. The darker the color, the greater
the number of large fires. (b) Fire recurrence interval. The
legend goes from dark to light, representing “high” to
“low” hazard. From Malamud et al. (2005)
13.3 Different Ecoregions, Different Fire Regimes
131
central regions tend to have frequent fires with
forest stand structures dominated by younger
trees, whereas the eastern region experiences
longer inter-fire intervals and older stand
structures. A statistical forecast methodology
developed by Westerling et al. (2002) exploits
these gradients to predict area burned in western
U.S. wildfires by ecoregion a season in advance.
Littell et al. (2009) found that climate drivers
of synchronous fire differ regionally. They
identified four distinct geographic patterns of
ecoregion provinces (ecoprovinces) across the
West, and each ecoprovince had its own unique
set of climate drivers that affect annual area
burned by wildfire. For example, in northern
mountain ecoprovinces dry, warm conditions
during the seasons leading up to and including
Fig. 13.3 Maps of wildfire patterns across the conterminous United States for 1970–2000 for US Forest Service
wildfires classified by ecoregion division. (a) Ratio of
large to small wildfires. The darker the color, the greater
the number of large fires. (b) Fire recurrence interval. The
legend goes from dark to light, representing “high” to
“low” hazard. From Malamud et al. (2005)
13.3 Different Ecoregions, Different Fire Regimes
131