

Global Change: the Problem of Detection
209
0.6~----------------------------------------------------'
0.4
little ice age
0.2
>Ri
0
E
o
c:
«
-0.2
- 0.4
1670
1690
1910
1930
1950
1970
1990
Year
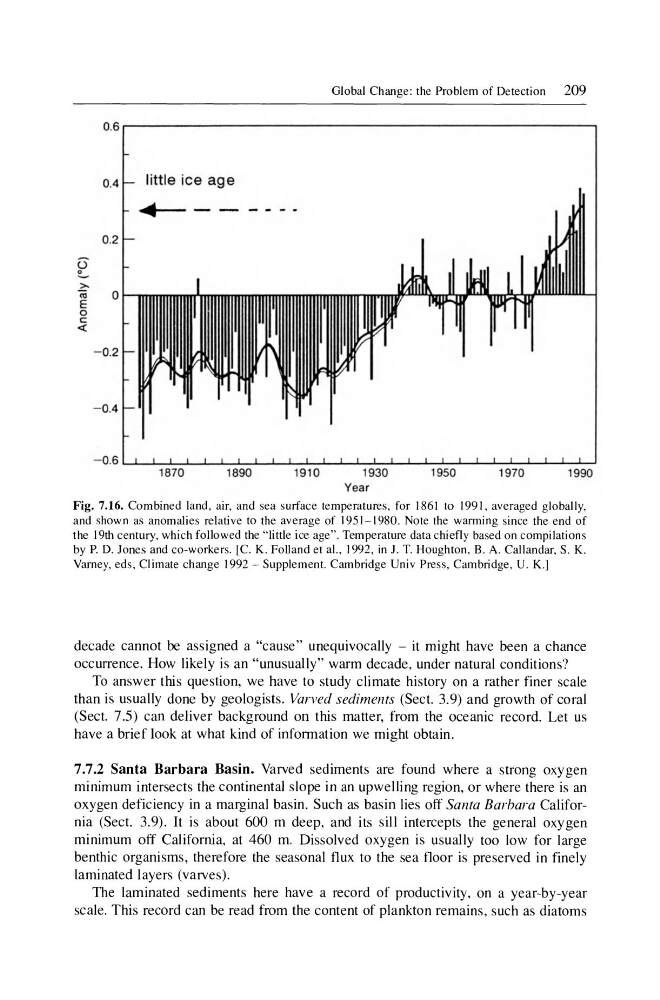
Fig. 7.16. Combined land, air, and sea surface temperatures, for 1861 to 1991 , averaged globally,
and shown as anomalies relative to the average of 1951-1980. Note the warming since the end of
the 19th century, which followed the " little ice age" . Temperature data chiefly based on compilations
by P. D. Jones and co-workers. [CO K. FoUand et aI. , 1992 , in J. T. Houghton, B. A. Callandar, S. K.
Varney, eds, Climate change 1992 - Supplement. Cambridge Univ Press, Cambridge, U. K.J
decade cannot be assigned a "cause" unequivocally - it might have been a chance
occurrence. How likely is an "unusually" warm decade, under natural conditions?
To answer this question, we have to study climate history on a rather finer scale
than is usually done by geologists. Varved sediments (Sect. 3.9) and growth of coral
(Sect. 7.5) can deliver background on this matter, from the oceanic record. Let us
have a brief look at what kind of information we might obtain.
7.7.2 Santa Barbara Basin. Varved sediments are found where a strong oxygen
minimum intersects the continental slope in an upwelling region , or where there is an
oxygen deficiency in a marginal basin. Such as basin lies off Santa Barbara California (Sect. 3.9). It is about 600 m deep, and its sill intercepts the general oxygen
minimum off California, at 460 m. Dissolved oxygen is usually too low for large
benthic organisms, therefore the seasonal flux to the sea floor is preserved in finely
laminated layers (varves).
The laminated sediments here have a record of productivity, on a year-by-year
scale. This record can be read from the content of plankton remains, such as diatoms
209
0.6~----------------------------------------------------'
0.4
little ice age
0.2
>Ri
0
E
o
c:
«
-0.2
- 0.4
1670
1690
1910
1930
1950
1970
1990
Year
Fig. 7.16. Combined land, air, and sea surface temperatures, for 1861 to 1991 , averaged globally,
and shown as anomalies relative to the average of 1951-1980. Note the warming since the end of
the 19th century, which followed the " little ice age" . Temperature data chiefly based on compilations
by P. D. Jones and co-workers. [CO K. FoUand et aI. , 1992 , in J. T. Houghton, B. A. Callandar, S. K.
Varney, eds, Climate change 1992 - Supplement. Cambridge Univ Press, Cambridge, U. K.J
decade cannot be assigned a "cause" unequivocally - it might have been a chance
occurrence. How likely is an "unusually" warm decade, under natural conditions?
To answer this question, we have to study climate history on a rather finer scale
than is usually done by geologists. Varved sediments (Sect. 3.9) and growth of coral
(Sect. 7.5) can deliver background on this matter, from the oceanic record. Let us
have a brief look at what kind of information we might obtain.
7.7.2 Santa Barbara Basin. Varved sediments are found where a strong oxygen
minimum intersects the continental slope in an upwelling region , or where there is an
oxygen deficiency in a marginal basin. Such as basin lies off Santa Barbara California (Sect. 3.9). It is about 600 m deep, and its sill intercepts the general oxygen
minimum off California, at 460 m. Dissolved oxygen is usually too low for large
benthic organisms, therefore the seasonal flux to the sea floor is preserved in finely
laminated layers (varves).
The laminated sediments here have a record of productivity, on a year-by-year
scale. This record can be read from the content of plankton remains, such as diatoms