

202 Imprint of Climatic Zonation on Marine Sediments
a
36~-----------------------------------------r+l_
~ 35
~
...J
«
V>
UJ
u
It a:
~
34
b
4()oN
30"
20'
10'
0'
10'
20°
30"
~
z
o
~
n:
~
o ~
2
~
z
o
i=
« a:
o
"'«
- 1 ~
/,(),
500S
> 1000 mm Iyr
eoxcess eovaporation
eoxcess preocipitation
>1000mmlyr
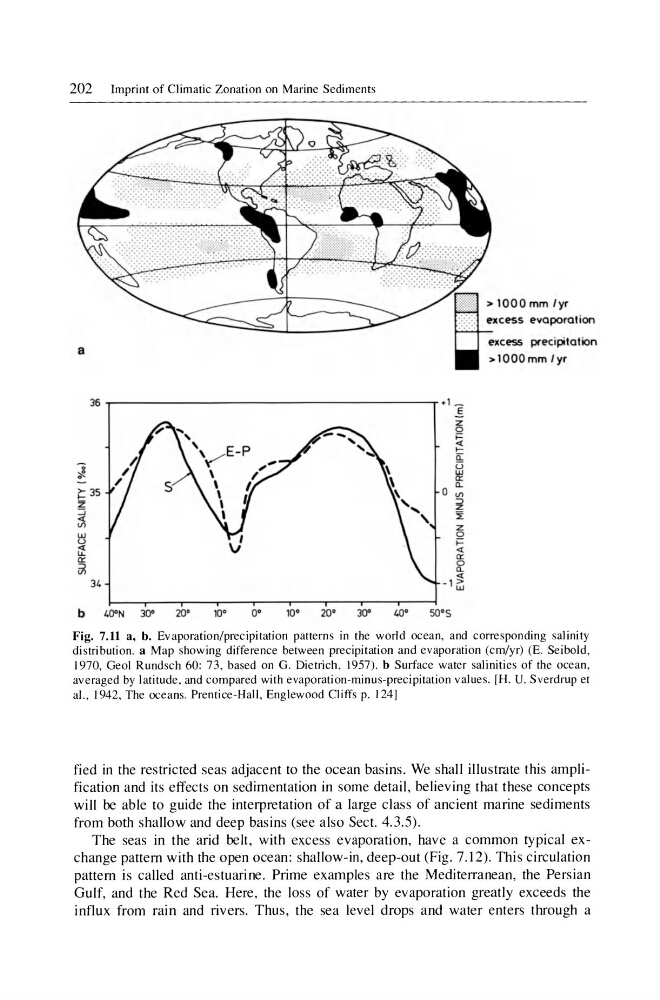
Fig. 7.1l a, b. Evaporation/precipitation patterns in the world ocean, and corresponding salinity
distribution. a Map showing difference between precipitation and evaporation (cm/yr) (E. Seibold.
1970, Geol Rundsch 60: 73 , based on G. Dietrich, 1957). b Surface water salinities of the ocean,
averaged by latitude. and compared with evaporation-minus-precipitation values. [H. U. Sverdrup et
aI., 1942. The oceans. Prentice-Hall , Englewood Cliffs p. 124]
fied in the restricted seas adjacent to the ocean basins. We shall illustrate this amplification and its effects on sedimentation in some detail , believing that these concepts
will be able to guide the interpretation of a large class of ancient marine sediments
from both shallow and deep basins (see also Sect. 4.3.5).
The seas in the arid belt, with excess evaporation, have a common typical exchange pattern with the open ocean: shallow-in, deep-out (Fig. 7.12). This circulation
pattern is called anti-estuarine. Prime examples are the Mediterranean, the Persian
Gulf, and the Red Sea. Here, the loss of water by evaporation greatly exceeds the
influx from rain and rivers. Thus, the sea level drops and water enters through a
a
36~-----------------------------------------r+l_
~ 35
~
...J
«
V>
UJ
u
It a:
~
34
b
4()oN
30"
20'
10'
0'
10'
20°
30"
~
z
o
~
n:
~
o ~
2
~
z
o
i=
« a:
o
"'«
- 1 ~
/,(),
500S
> 1000 mm Iyr
eoxcess eovaporation
eoxcess preocipitation
>1000mmlyr
Fig. 7.1l a, b. Evaporation/precipitation patterns in the world ocean, and corresponding salinity
distribution. a Map showing difference between precipitation and evaporation (cm/yr) (E. Seibold.
1970, Geol Rundsch 60: 73 , based on G. Dietrich, 1957). b Surface water salinities of the ocean,
averaged by latitude. and compared with evaporation-minus-precipitation values. [H. U. Sverdrup et
aI., 1942. The oceans. Prentice-Hall , Englewood Cliffs p. 124]
fied in the restricted seas adjacent to the ocean basins. We shall illustrate this amplification and its effects on sedimentation in some detail , believing that these concepts
will be able to guide the interpretation of a large class of ancient marine sediments
from both shallow and deep basins (see also Sect. 4.3.5).
The seas in the arid belt, with excess evaporation, have a common typical exchange pattern with the open ocean: shallow-in, deep-out (Fig. 7.12). This circulation
pattern is called anti-estuarine. Prime examples are the Mediterranean, the Persian
Gulf, and the Red Sea. Here, the loss of water by evaporation greatly exceeds the
influx from rain and rivers. Thus, the sea level drops and water enters through a