

3 Isotope Geochemistry of River Water
41
t.O3
t,..
0.716
0.714
0.712
0.710
0.708 ~
0706
0.704
Amaz.
9
# /
9
MiS~O r &
9
"~
/ ~
tn 9
El pacific
Au.Ocea,,"" /
! 1
Ind.Oceanl 9
AA
I
I
J Average river water ]
9 A
41D
IAverage value for seawater I
9
10
I
I
t
I
I
I
-
-16
-12
-8
-4
0
4
g~(O)
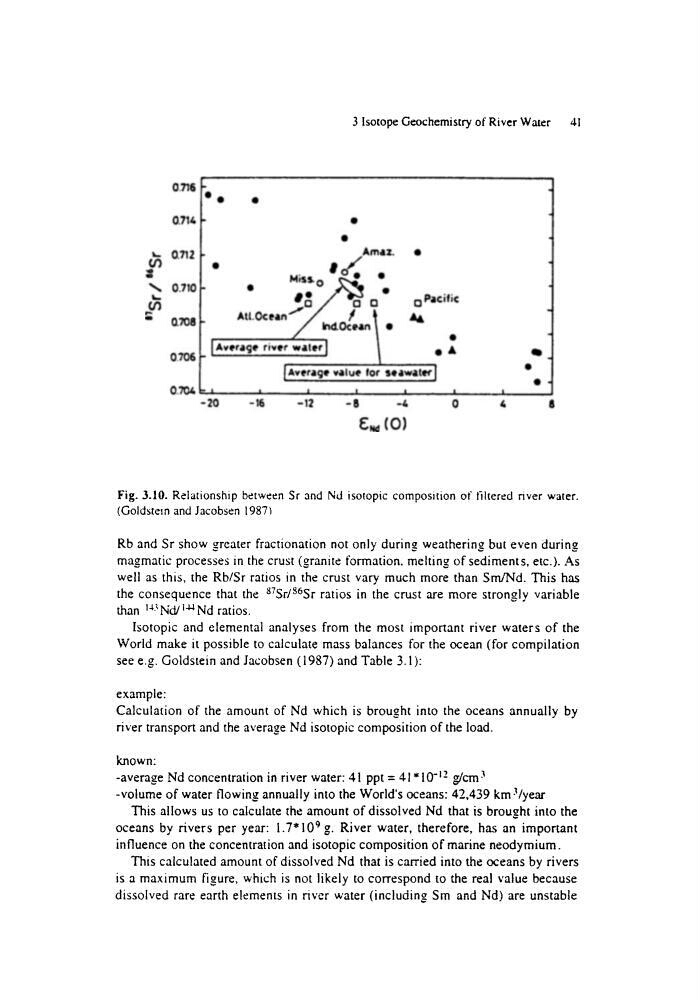
Fig. 3.10. Relationship between Sr and Nd isotopic composition of filtered river water.
(Goldstein and Jacobsen 19871
Rb and Sr show greater fractionation not only during weathering but even during
magmatic processes in the crust (granite formation, melting of sediments, etc.). As
well as this, the Rb/Sr ratios in the crust vary much more than Sm/Nd. This has
the consequence that the 87Sr/S6Sr ratios in the crust are more strongly variable
than J43 Nd/1-~ Nd ratios.
Isotopic and elemental analyses from the most important river waters of the
World make it possible to calculate mass balances for the ocean (for compilation
see e.g. Goldstein and Jacobsen (1987) and Table 3. I):
example:
Calculation of the amount of Nd which is brought into the oceans annually by
river transport and the average Nd isotopic composition of the load.
known:
-average Nd concentration in river water: 41 ppt = 41 =I0"12 ~crn 3
-volume of water flowing annually into the World's oceans: 42,439 km 31year
This allows us to calculate the amount of dissolved Nd that is brought into the
oceans by rivers per year: 1.7"109 g. River water, therefore, has an important
influence on the concentration and isotopic composition of marine neodymium.
This calculated amount of dissolved Nd that is carried into the oceans by rivers
is a maximum figure, which is not likely to correspond to the real value because
dissolved rare earth elements in river water (including Sm and Nd) are unstable
41
t.O3
t,..
0.716
0.714
0.712
0.710
0.708 ~
0706
0.704
Amaz.
9
# /
9
MiS~O r &
9
"~
/ ~
tn 9
El pacific
Au.Ocea,,"" /
! 1
Ind.Oceanl 9
AA
I
I
J Average river water ]
9 A
41D
IAverage value for seawater I
9
10
I
I
t
I
I
I
-
-16
-12
-8
-4
0
4
g~(O)
Fig. 3.10. Relationship between Sr and Nd isotopic composition of filtered river water.
(Goldstein and Jacobsen 19871
Rb and Sr show greater fractionation not only during weathering but even during
magmatic processes in the crust (granite formation, melting of sediments, etc.). As
well as this, the Rb/Sr ratios in the crust vary much more than Sm/Nd. This has
the consequence that the 87Sr/S6Sr ratios in the crust are more strongly variable
than J43 Nd/1-~ Nd ratios.
Isotopic and elemental analyses from the most important river waters of the
World make it possible to calculate mass balances for the ocean (for compilation
see e.g. Goldstein and Jacobsen (1987) and Table 3. I):
example:
Calculation of the amount of Nd which is brought into the oceans annually by
river transport and the average Nd isotopic composition of the load.
known:
-average Nd concentration in river water: 41 ppt = 41 =I0"12 ~crn 3
-volume of water flowing annually into the World's oceans: 42,439 km 31year
This allows us to calculate the amount of dissolved Nd that is brought into the
oceans by rivers per year: 1.7"109 g. River water, therefore, has an important
influence on the concentration and isotopic composition of marine neodymium.
This calculated amount of dissolved Nd that is carried into the oceans by rivers
is a maximum figure, which is not likely to correspond to the real value because
dissolved rare earth elements in river water (including Sm and Nd) are unstable