

6 Isotope Geochemistry of Clay Minerals 171
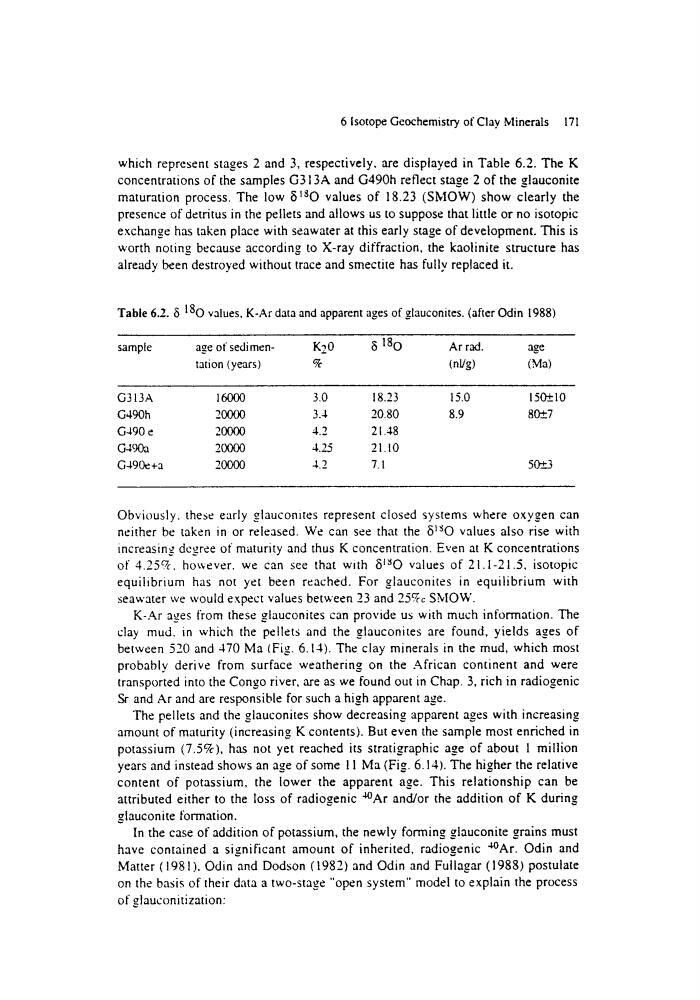
which represent stages 2 and 3, respectively, are displayed in Table 6.2. The K
concentrations of the samples G313A and G490h reflect stage 2 of the glauconite
maturation process. The low 51sO values of 18.23 (SMOW) show clearly the
presence of detritus in the pellets and allows us to suppose that little or no isotopic
exchange has taken place with seawater at this early stage of development. This is
worth noting because according to X-ray diffraction, the kaolinite structure has
already been destroyed without trace and smectite has fully replaced it.
Table 6.2. 8 180 values. K-At data and apparent ages of glauconites. (after Odin 1988)
sample
age or sedi menK20
c3 18 0
Ar tad.
age
tation (years)
%
(hi/g)
(Ma)
G313A
16000
3.0
18.23
15.0
150k-_ 10
G490h
20000
3.4
20.80
8.9
80-L-_7
G490 e
20000
4.2
21.48
G490a
20000
4.25
21. I 0
G490e+a
201300
4.2
7.1
50"+_. . 3
Obviously. these early glauconites represent closed systems where oxygen can
neither be taken in or released. We can see that the 8~so values also rise with
increasing degree of maturity and thus K concentration. Even at K concentrations
of 4.25.c7c, ho~,,ever, we can see that with 5tsO values of 21.1-21.5, isotopic
equilibrium has not yet been reached. For glauconites in equilibrium with
seawater we would expect values between 23 and 25%c SMOW.
K-Ar ages from these glauconites can provide us with much information. The
clay mud. in which the pellets and the glauconites are found, yields ages of
between 520 and 470 Ma (Fig. 6.14). The clay minerals in the mud, which most
probably derive from surface weathering on the African continent and were
transported into the Congo river, are as we found out in Chap. 3, rich in radiogenic
Sr and Ar and are responsible for such a high apparent age.
The pellets and the glauconites show decreasing apparent ages with increasing
amount of maturity (increasing K contents). But even the sample most enriched in
potassium (7.5%), has not yet reached its stratigraphic age of about 1 million
years and instead shows an age of some I1 Ma (Fig. 6.14). The higher the relative
content of potassium, the lower the apparent age. This relationship can be
attributed either to the loss of radiogenic a~ and/or the addition of K during
glauconite tbrmation.
In the case of addition of potassium, the newly forming glauconite grains must
have contained a significant amount of inherited, radiogenic "*OAr. Odin and
Matter (1981). Odin and Dodson (1982) and Odin and Fullagar (1988) postulate
on the basis of their data a two-stage "open system" model to explain the process
of glauconitization:
which represent stages 2 and 3, respectively, are displayed in Table 6.2. The K
concentrations of the samples G313A and G490h reflect stage 2 of the glauconite
maturation process. The low 51sO values of 18.23 (SMOW) show clearly the
presence of detritus in the pellets and allows us to suppose that little or no isotopic
exchange has taken place with seawater at this early stage of development. This is
worth noting because according to X-ray diffraction, the kaolinite structure has
already been destroyed without trace and smectite has fully replaced it.
Table 6.2. 8 180 values. K-At data and apparent ages of glauconites. (after Odin 1988)
sample
age or sedi menK20
c3 18 0
Ar tad.
age
tation (years)
%
(hi/g)
(Ma)
G313A
16000
3.0
18.23
15.0
150k-_ 10
G490h
20000
3.4
20.80
8.9
80-L-_7
G490 e
20000
4.2
21.48
G490a
20000
4.25
21. I 0
G490e+a
201300
4.2
7.1
50"+_. . 3
Obviously. these early glauconites represent closed systems where oxygen can
neither be taken in or released. We can see that the 8~so values also rise with
increasing degree of maturity and thus K concentration. Even at K concentrations
of 4.25.c7c, ho~,,ever, we can see that with 5tsO values of 21.1-21.5, isotopic
equilibrium has not yet been reached. For glauconites in equilibrium with
seawater we would expect values between 23 and 25%c SMOW.
K-Ar ages from these glauconites can provide us with much information. The
clay mud. in which the pellets and the glauconites are found, yields ages of
between 520 and 470 Ma (Fig. 6.14). The clay minerals in the mud, which most
probably derive from surface weathering on the African continent and were
transported into the Congo river, are as we found out in Chap. 3, rich in radiogenic
Sr and Ar and are responsible for such a high apparent age.
The pellets and the glauconites show decreasing apparent ages with increasing
amount of maturity (increasing K contents). But even the sample most enriched in
potassium (7.5%), has not yet reached its stratigraphic age of about 1 million
years and instead shows an age of some I1 Ma (Fig. 6.14). The higher the relative
content of potassium, the lower the apparent age. This relationship can be
attributed either to the loss of radiogenic a~ and/or the addition of K during
glauconite tbrmation.
In the case of addition of potassium, the newly forming glauconite grains must
have contained a significant amount of inherited, radiogenic "*OAr. Odin and
Matter (1981). Odin and Dodson (1982) and Odin and Fullagar (1988) postulate
on the basis of their data a two-stage "open system" model to explain the process
of glauconitization: