

1130 Peter Stille and Graham Shields
S a m p l e selection in the field
sample composition?
l
metamorphosed?
~Thin-selection analysis i
concentrated weak acid d ~ l u t i o n
sample purity?
[Stable isotopes [
mineralogy?
,
i~12C
homogeneity?
8180
/
very negative values?
ICathodo-luminescence I
I% i.hsoluble residue I
detritus?
\
Trace elements
"
I
(Rb) leaching detritus?
(Mg) dolomite leaching?
(St) diagenetic exchange of St?
high Mn/Sr?
high Fe/Sr?
diagenettc trace element exchange?
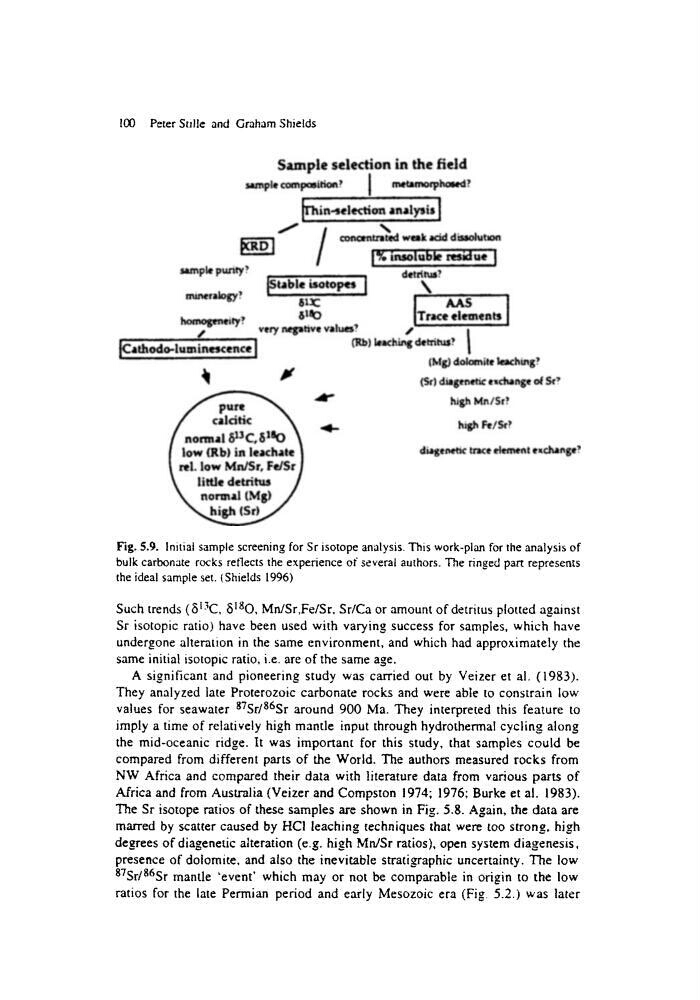
Fig. 5.9. Initial sample screening for Sr isotope analysis. This work-plan for the analysis of
bulk carbonate rocks reflects the experience of several authors. The ringed part represents
the ideal sample set. (Shields 1996)
Such trends (513C, 5180, Mn/Sr,Fe/Sr, Sr/Ca or amount of detritus plotted against
Sr isotopic ratio) have been used with varying success for samples, which have
undergone alteration in the same environment, and which had approximately the
same initial isotopic ratio, i.e. are of the same age.
A significant and pioneering study was carried out by Veizer et al. (1983).
They analyzed late Proterozoic carbonate rocks and were able to constrain low
values for seawater S7Sr/86Sr around 900 Ma. They interpreted this feature to
imply a time of relatively high mantle input through hydrothermal cycling along
the mid-oceanic ridge. It was important for this study, that samples could be
compared from different parts of the World. The authors measured rocks from
NW Africa and compared their data with literature data from various parts of
Africa and from Australia (Veizer and Compston 1974; 1976; Burke et al. 1983).
The Sr isotope ratios of these samples are shown in Fig. 5.8. Again, the data are
marred by scatter caused by HCI leaching techniques that were too strong, high
degrees of diagenetic alteration (e.g. high Mn/Sr ratios), open system diagenesis,
presence of dolomite, and also the inevitable stratigraphic uncertainty. The low
87Sr/86Sr mantle 'event' which may or not be comparable in origin to the low
ratios for the late Permian period and early Mesozoic era (Fig 5.2.) was later
S a m p l e selection in the field
sample composition?
l
metamorphosed?
~Thin-selection analysis i
concentrated weak acid d ~ l u t i o n
sample purity?
[Stable isotopes [
mineralogy?
,
i~12C
homogeneity?
8180
/
very negative values?
ICathodo-luminescence I
I% i.hsoluble residue I
detritus?
\
Trace elements
"
I
(Rb) leaching detritus?
(Mg) dolomite leaching?
(St) diagenetic exchange of St?
high Mn/Sr?
high Fe/Sr?
diagenettc trace element exchange?
Fig. 5.9. Initial sample screening for Sr isotope analysis. This work-plan for the analysis of
bulk carbonate rocks reflects the experience of several authors. The ringed part represents
the ideal sample set. (Shields 1996)
Such trends (513C, 5180, Mn/Sr,Fe/Sr, Sr/Ca or amount of detritus plotted against
Sr isotopic ratio) have been used with varying success for samples, which have
undergone alteration in the same environment, and which had approximately the
same initial isotopic ratio, i.e. are of the same age.
A significant and pioneering study was carried out by Veizer et al. (1983).
They analyzed late Proterozoic carbonate rocks and were able to constrain low
values for seawater S7Sr/86Sr around 900 Ma. They interpreted this feature to
imply a time of relatively high mantle input through hydrothermal cycling along
the mid-oceanic ridge. It was important for this study, that samples could be
compared from different parts of the World. The authors measured rocks from
NW Africa and compared their data with literature data from various parts of
Africa and from Australia (Veizer and Compston 1974; 1976; Burke et al. 1983).
The Sr isotope ratios of these samples are shown in Fig. 5.8. Again, the data are
marred by scatter caused by HCI leaching techniques that were too strong, high
degrees of diagenetic alteration (e.g. high Mn/Sr ratios), open system diagenesis,
presence of dolomite, and also the inevitable stratigraphic uncertainty. The low
87Sr/86Sr mantle 'event' which may or not be comparable in origin to the low
ratios for the late Permian period and early Mesozoic era (Fig 5.2.) was later