

83
If we now assume that oxygen reacts in the sediment exclusively with C org in a ratio of 106:138 as
Froelich et al. (1979) have indicated (cf. Section
3.2.5), then we obtain the amount of C org which is
annually oxidized per m 2 :
R ox,Corg = 0.47 · (106/138) · 12
= 4.4 [gC m -2 a -1 ]
(3.10)
It must be pointed out that we have to differentiate very distinctly between two very different
statements. On the one hand, the profile inescapably proves that 0.47 mol m -2 a -1 oxygen are consumed in the sediment. On the other hand, the calculation that 4.4 g m -2 a -1 C org is equivalent to this
amount requires that all oxygen is, in fact, used in
the oxidation of organic matter. However, it is
imaginable that at least a fraction of oxygen is
consumed by the oxidation of other reduced inorganic solute species (e.g. Fe 2+ , Mn 2+ , or NH 4
+ ; cf.
also with example shown in Fig. 3.8). There is
indeed evidence that, depending on the specific
conditions of the various marine environments,
one or the other reaction contributes more or less
to the consumption of oxygen. At any rate, this
needs to be verified by other measurements, for
instance, by recording the concentration profiles
of the reducing solute species.
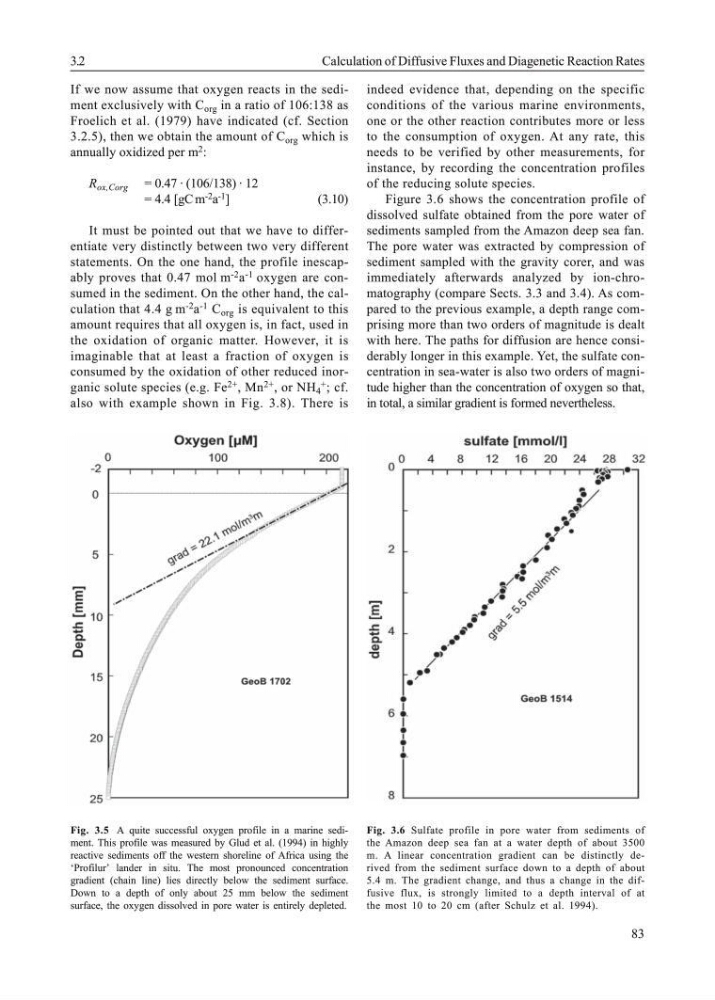
Figure 3.6 shows the concentration profile of
dissolved sulfate obtained from the pore water of
sediments sampled from the Amazon deep sea fan.
The pore water was extracted by compression of
sediment sampled with the gravity corer, and was
immediately afterwards analyzed by ion-chromatography (compare Sects. 3.3 and 3.4). As compared to the previous example, a depth range comprising more than two orders of magnitude is dealt
with here. The paths for diffusion are hence considerably longer in this example. Yet, the sulfate concentration in sea-water is also two orders of magnitude higher than the concentration of oxygen so that,
in total, a similar gradient is formed nevertheless.
Fig. 3.5 A quite successful oxygen profile in a marine sediment. This profile was measured by Glud et al. (1994) in highly
reactive sediments off the western shoreline of Africa using the
‘Profilur’ lander in situ. The most pronounced concentration
gradient (chain line) lies directly below the sediment surface.
Down to a depth of only about 25 mm below the sediment
surface, the oxygen dissolved in pore water is entirely depleted.
3.2
Calculation of Diffusive Fluxes and Diagenetic Reaction Rates
Fig. 3.6 Sulfate profile in pore water from sediments of
the Amazon deep sea fan at a water depth of about 3500
m. A linear concentration gradient can be distinctly derived from the sediment surface down to a depth of about
5.4 m. The gradient change, and thus a change in the diffusive flux, is strongly limited to a depth interval of at
the most 10 to 20 cm (after Schulz et al. 1994).
If we now assume that oxygen reacts in the sediment exclusively with C org in a ratio of 106:138 as
Froelich et al. (1979) have indicated (cf. Section
3.2.5), then we obtain the amount of C org which is
annually oxidized per m 2 :
R ox,Corg = 0.47 · (106/138) · 12
= 4.4 [gC m -2 a -1 ]
(3.10)
It must be pointed out that we have to differentiate very distinctly between two very different
statements. On the one hand, the profile inescapably proves that 0.47 mol m -2 a -1 oxygen are consumed in the sediment. On the other hand, the calculation that 4.4 g m -2 a -1 C org is equivalent to this
amount requires that all oxygen is, in fact, used in
the oxidation of organic matter. However, it is
imaginable that at least a fraction of oxygen is
consumed by the oxidation of other reduced inorganic solute species (e.g. Fe 2+ , Mn 2+ , or NH 4
+ ; cf.
also with example shown in Fig. 3.8). There is
indeed evidence that, depending on the specific
conditions of the various marine environments,
one or the other reaction contributes more or less
to the consumption of oxygen. At any rate, this
needs to be verified by other measurements, for
instance, by recording the concentration profiles
of the reducing solute species.
Figure 3.6 shows the concentration profile of
dissolved sulfate obtained from the pore water of
sediments sampled from the Amazon deep sea fan.
The pore water was extracted by compression of
sediment sampled with the gravity corer, and was
immediately afterwards analyzed by ion-chromatography (compare Sects. 3.3 and 3.4). As compared to the previous example, a depth range comprising more than two orders of magnitude is dealt
with here. The paths for diffusion are hence considerably longer in this example. Yet, the sulfate concentration in sea-water is also two orders of magnitude higher than the concentration of oxygen so that,
in total, a similar gradient is formed nevertheless.
Fig. 3.5 A quite successful oxygen profile in a marine sediment. This profile was measured by Glud et al. (1994) in highly
reactive sediments off the western shoreline of Africa using the
‘Profilur’ lander in situ. The most pronounced concentration
gradient (chain line) lies directly below the sediment surface.
Down to a depth of only about 25 mm below the sediment
surface, the oxygen dissolved in pore water is entirely depleted.
3.2
Calculation of Diffusive Fluxes and Diagenetic Reaction Rates
Fig. 3.6 Sulfate profile in pore water from sediments of
the Amazon deep sea fan at a water depth of about 3500
m. A linear concentration gradient can be distinctly derived from the sediment surface down to a depth of about
5.4 m. The gradient change, and thus a change in the diffusive flux, is strongly limited to a depth interval of at
the most 10 to 20 cm (after Schulz et al. 1994).