

84
3
Quantification of Early Diagenesis: Dissolved Constituents in Marine Pore Water
In this case a concentration gradient of
5.5 mol m -3 m -1 was derived as a mean value for the
depths ranging from 0 to 5.4 m. Upon examining
the curve in more detail, it is obvious that the gradient is less pronounced in the upper 2 meters
which is probably explained by a somewhat higher
porosity and a concurrently unchanged diffusive
flux. As the discovered gradient within the sulfate
profile is located distinctly deeper under the sediment surface than in the previous example, it is
reasonable to assume a lower degree of porosity.
A porosity of φ = 0.60 yields, according to Table
3.2, a tortuosity value (θ 2 ) of 2.02. On consulting
Table 3.1 we find that the diffusion coefficient for
sulfate in sea-water at 5 °C is D sw = 5.72·10 -10 m 2 s -
1 . Using Equation 3.5 it follows that the diffusion
coefficient in the sediment amounts to D sed =
2.8·10 -10 m 2 s -1 . Thus, the diffusive sulfate flux
from the bottom water into the sediment corresponds to J sed, sulfate :
J sed,sulfate = - 0.60 · 2.8·10 -10 · 5.5
= - 9.2·10 -10 [mol m -2 s -1 ]
(3.11)
To arrive at more relevant figures and for reasons
of comparison with other sedimentologic data, we
multiply this value with the number of seconds in
one year (31,536,000) and obtain:
J sed,sulfate = - 9.2·10 -10 · 31,536,000
= - 0.029 [mol m -2 a -1 ]
(3.12)
If we assume that sulfate reacts in the sediment
exclusively with C org , in a ratio of 106:53 as
Froelich et al. (1979) have reported, then for the
amount of C org that is annually oxidized per square
meter amounts to:
R ox,Corg = 0.029 · (106/53) · 12
= 0.70 [gC m -2 a -1 ]
(3.13)
It should be indicated at this point as well that
the calculated diffusive sulfate flux from the bottom water into the sediment, and from there into
a depth of about 5.4 m, is the unequivocal consequence of the profile shown in Figure 3.6. It also
follows that this sulfate is degraded in the depth
of 5.4 m within a depth interval of at the most 10
to 20 cm thickness. The calculated C org amount
that undergoes conversion again depends on the
assumption made by Froelich et al. (1979) that indeed the whole of sulfate reacts with organic carbon. Several studies demonstrated that this must
not be generally the case. For sediments obtained from the Skagerak, Iversen and Jørgensen
(1985) showed that an essential proportion of
sulfate is consumed in the oxidation of methane.
At different locations of the upwelling area off the
shores of Namibia and Angola, Niewöhner et al.
(1998) could even prove that the entire amount of
sulfate is consumed due to the oxidation of methane which diffuses upwards in an according
gradient.
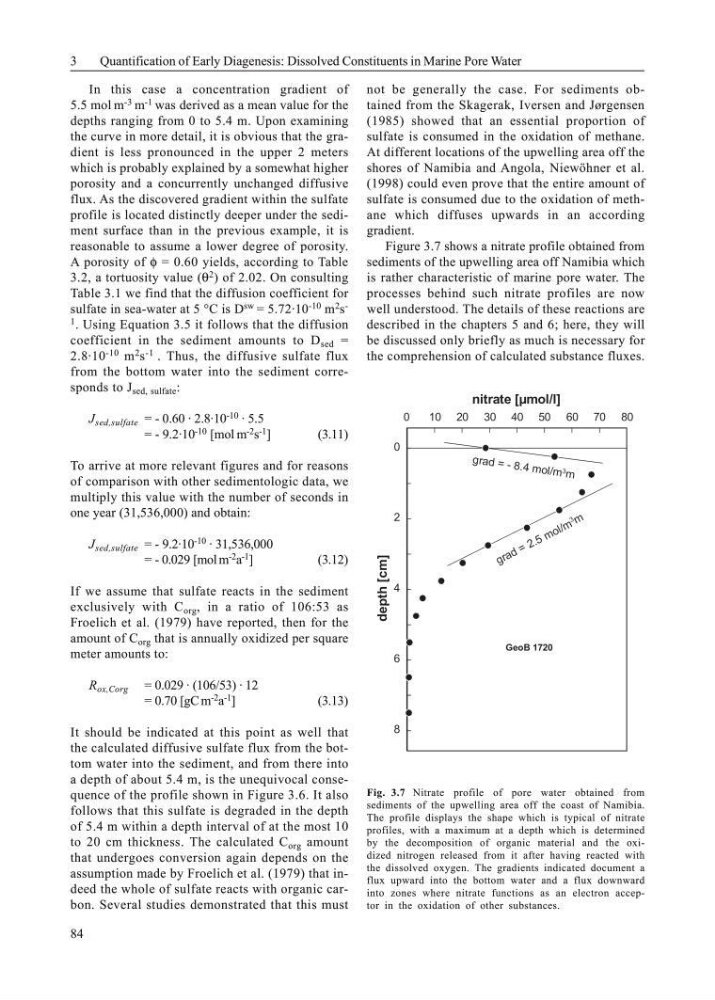
Figure 3.7 shows a nitrate profile obtained from
sediments of the upwelling area off Namibia which
is rather characteristic of marine pore water. The
processes behind such nitrate profiles are now
well understood. The details of these reactions are
described in the chapters 5 and 6; here, they will
be discussed only briefly as much is necessary for
the comprehension of calculated substance fluxes.
Fig. 3.7 Nitrate profile of pore water obtained from
sediments of the upwelling area off the coast of Namibia.
The profile displays the shape which is typical of nitrate
profiles, with a maximum at a depth which is determined
by the decomposition of organic material and the oxidized nitrogen released from it after having reacted with
the dissolved oxygen. The gradients indicated document a
flux upward into the bottom water and a flux downward
into zones where nitrate functions as an electron acceptor in the oxidation of other substances.
0
2
4
6
8
depth [cm]
80
70
60
50
40
30
20
10
0
GeoB 1720
g r a d = 2 .5 m o l/ m
3 m
gr ad = - 8. 4 m ol/ m 3 m
nitrate [µmol/l]
3
Quantification of Early Diagenesis: Dissolved Constituents in Marine Pore Water
In this case a concentration gradient of
5.5 mol m -3 m -1 was derived as a mean value for the
depths ranging from 0 to 5.4 m. Upon examining
the curve in more detail, it is obvious that the gradient is less pronounced in the upper 2 meters
which is probably explained by a somewhat higher
porosity and a concurrently unchanged diffusive
flux. As the discovered gradient within the sulfate
profile is located distinctly deeper under the sediment surface than in the previous example, it is
reasonable to assume a lower degree of porosity.
A porosity of φ = 0.60 yields, according to Table
3.2, a tortuosity value (θ 2 ) of 2.02. On consulting
Table 3.1 we find that the diffusion coefficient for
sulfate in sea-water at 5 °C is D sw = 5.72·10 -10 m 2 s -
1 . Using Equation 3.5 it follows that the diffusion
coefficient in the sediment amounts to D sed =
2.8·10 -10 m 2 s -1 . Thus, the diffusive sulfate flux
from the bottom water into the sediment corresponds to J sed, sulfate :
J sed,sulfate = - 0.60 · 2.8·10 -10 · 5.5
= - 9.2·10 -10 [mol m -2 s -1 ]
(3.11)
To arrive at more relevant figures and for reasons
of comparison with other sedimentologic data, we
multiply this value with the number of seconds in
one year (31,536,000) and obtain:
J sed,sulfate = - 9.2·10 -10 · 31,536,000
= - 0.029 [mol m -2 a -1 ]
(3.12)
If we assume that sulfate reacts in the sediment
exclusively with C org , in a ratio of 106:53 as
Froelich et al. (1979) have reported, then for the
amount of C org that is annually oxidized per square
meter amounts to:
R ox,Corg = 0.029 · (106/53) · 12
= 0.70 [gC m -2 a -1 ]
(3.13)
It should be indicated at this point as well that
the calculated diffusive sulfate flux from the bottom water into the sediment, and from there into
a depth of about 5.4 m, is the unequivocal consequence of the profile shown in Figure 3.6. It also
follows that this sulfate is degraded in the depth
of 5.4 m within a depth interval of at the most 10
to 20 cm thickness. The calculated C org amount
that undergoes conversion again depends on the
assumption made by Froelich et al. (1979) that indeed the whole of sulfate reacts with organic carbon. Several studies demonstrated that this must
not be generally the case. For sediments obtained from the Skagerak, Iversen and Jørgensen
(1985) showed that an essential proportion of
sulfate is consumed in the oxidation of methane.
At different locations of the upwelling area off the
shores of Namibia and Angola, Niewöhner et al.
(1998) could even prove that the entire amount of
sulfate is consumed due to the oxidation of methane which diffuses upwards in an according
gradient.
Figure 3.7 shows a nitrate profile obtained from
sediments of the upwelling area off Namibia which
is rather characteristic of marine pore water. The
processes behind such nitrate profiles are now
well understood. The details of these reactions are
described in the chapters 5 and 6; here, they will
be discussed only briefly as much is necessary for
the comprehension of calculated substance fluxes.
Fig. 3.7 Nitrate profile of pore water obtained from
sediments of the upwelling area off the coast of Namibia.
The profile displays the shape which is typical of nitrate
profiles, with a maximum at a depth which is determined
by the decomposition of organic material and the oxidized nitrogen released from it after having reacted with
the dissolved oxygen. The gradients indicated document a
flux upward into the bottom water and a flux downward
into zones where nitrate functions as an electron acceptor in the oxidation of other substances.
0
2
4
6
8
depth [cm]
80
70
60
50
40
30
20
10
0
GeoB 1720
g r a d = 2 .5 m o l/ m
3 m
gr ad = - 8. 4 m ol/ m 3 m
nitrate [µmol/l]