

2
Physical Properties of Marine Sediments
50
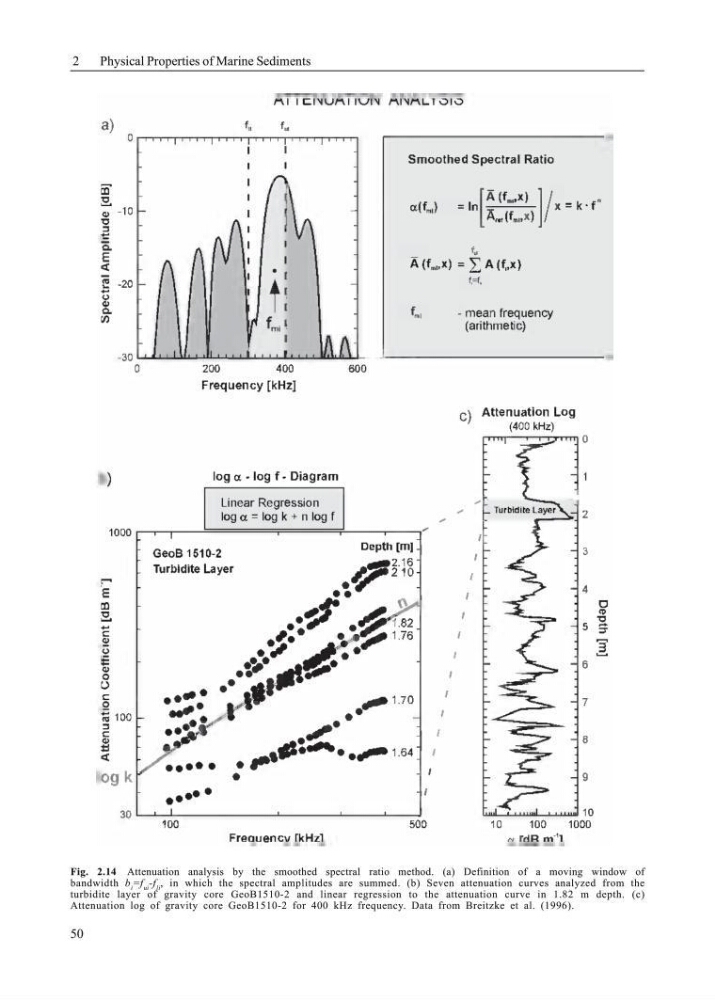
Fig. 2.14 Attenuation analysis by the smoothed spectral ratio method. (a) Definition of a moving window of
bandwidth b i =f ui -f li , in which the spectral amplitudes are summed. (b) Seven attenuation curves analyzed from the
turbidite layer of gravity core GeoB1510-2 and linear regression to the attenuation curve in 1.82 m depth. (c)
Attenuation log of gravity core GeoB1510-2 for 400 kHz frequency. Data from Breitzke et al. (1996).
Physical Properties of Marine Sediments
50
Fig. 2.14 Attenuation analysis by the smoothed spectral ratio method. (a) Definition of a moving window of
bandwidth b i =f ui -f li , in which the spectral amplitudes are summed. (b) Seven attenuation curves analyzed from the
turbidite layer of gravity core GeoB1510-2 and linear regression to the attenuation curve in 1.82 m depth. (c)
Attenuation log of gravity core GeoB1510-2 for 400 kHz frequency. Data from Breitzke et al. (1996).