

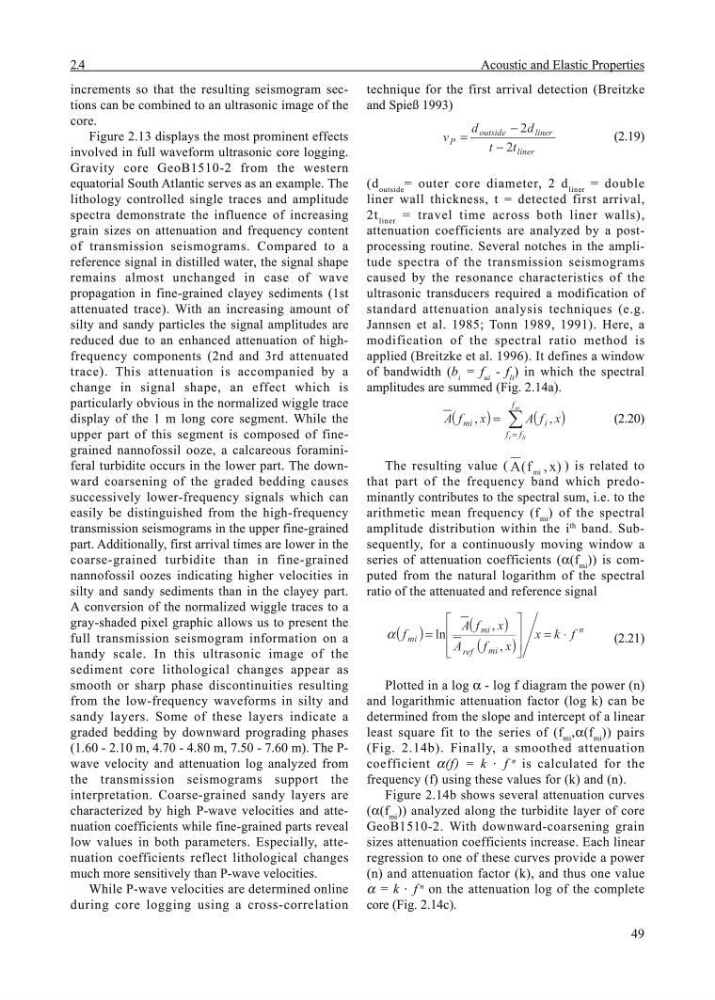
49
increments so that the resulting seismogram sections can be combined to an ultrasonic image of the
core.
Figure 2.13 displays the most prominent effects
involved in full waveform ultrasonic core logging.
Gravity core GeoB1510-2 from the western
equatorial South Atlantic serves as an example. The
lithology controlled single traces and amplitude
spectra demonstrate the influence of increasing
grain sizes on attenuation and frequency content
of transmission seismograms. Compared to a
reference signal in distilled water, the signal shape
remains almost unchanged in case of wave
propagation in fine-grained clayey sediments (1st
attenuated trace). With an increasing amount of
silty and sandy particles the signal amplitudes are
reduced due to an enhanced attenuation of highfrequency components (2nd and 3rd attenuated
trace). This attenuation is accompanied by a
change in signal shape, an effect which is
particularly obvious in the normalized wiggle trace
display of the 1 m long core segment. While the
upper part of this segment is composed of finegrained nannofossil ooze, a calcareous foraminiferal turbidite occurs in the lower part. The downward coarsening of the graded bedding causes
successively lower-frequency signals which can
easily be distinguished from the high-frequency
transmission seismograms in the upper fine-grained
part. Additionally, first arrival times are lower in the
coarse-grained turbidite than in fine-grained
nannofossil oozes indicating higher velocities in
silty and sandy sediments than in the clayey part.
A conversion of the normalized wiggle traces to a
gray-shaded pixel graphic allows us to present the
full transmission seismogram information on a
handy scale. In this ultrasonic image of the
sediment core lithological changes appear as
smooth or sharp phase discontinuities resulting
from the low-frequency waveforms in silty and
sandy layers. Some of these layers indicate a
graded bedding by downward prograding phases
(1.60 - 2.10 m, 4.70 - 4.80 m, 7.50 - 7.60 m). The Pwave velocity and attenuation log analyzed from
the transmission seismograms support the
interpretation. Coarse-grained sandy layers are
characterized by high P-wave velocities and attenuation coefficients while fine-grained parts reveal
low values in both parameters. Especially, attenuation coefficients reflect lithological changes
much more sensitively than P-wave velocities.
While P-wave velocities are determined online
during core logging using a cross-correlation
technique for the first arrival detection (Breitzke
and Spieß 1993)
liner
liner
outside
P
t
t
d
d
v
2
2
−
−
=
(2.19)
(d outside = outer core diameter, 2 d liner = double
liner wall thickness, t = detected first arrival,
2t liner = travel time across both liner walls),
attenuation coefficients are analyzed by a postprocessing routine. Several notches in the amplitude spectra of the transmission seismograms
caused by the resonance characteristics of the
ultrasonic transducers required a modification of
standard attenuation analysis techniques (e.g.
Jannsen et al. 1985; Tonn 1989, 1991). Here, a
modification of the spectral ratio method is
applied (Breitzke et al. 1996). It defines a window
of bandwidth (b i = f ui - f li ) in which the spectral
amplitudes are summed (Fig. 2.14a).
(
)
( )
∑
=
=
ui
li
i
f
f
f
i
mi
x
f
A
x
f
A
,
,
(2.20)
The resulting value ( A f x
mi
( , ) ) is related to
that part of the frequency band which predominantly contributes to the spectral sum, i.e. to the
arithmetic mean frequency (f mi ) of the spectral
amplitude distribution within the i
th
band. Subsequently, for a continuously moving window a
series of attenuation coefficients (α(f mi )) is computed from the natural logarithm of the spectral
ratio of the attenuated and reference signal
( )
(
)
(
)
n
mi
ref
mi
mi
f
k
x
x
f
A
x
f
A
f
⋅
=
⎥
⎥
⎦
⎤
⎢
⎢
⎣
⎡
=
,
,
ln
α
(2.21)
Plotted in a log α - log f diagram the power (n)
and logarithmic attenuation factor (log k) can be
determined from the slope and intercept of a linear
least square fit to the series of (f mi ,α(f mi )) pairs
(Fig. 2.14b). Finally, a smoothed attenuation
coefficient α(f) = k ⋅ f
n
is calculated for the
frequency (f) using these values for (k) and (n).
Figure 2.14b shows several attenuation curves
(α(f mi )) analyzed along the turbidite layer of core
GeoB1510-2. With downward-coarsening grain
sizes attenuation coefficients increase. Each linear
regression to one of these curves provide a power
(n) and attenuation factor (k), and thus one value
α = k ⋅ f
n
on the attenuation log of the complete
core (Fig. 2.14c).
2.4
Acoustic and Elastic Properties
increments so that the resulting seismogram sections can be combined to an ultrasonic image of the
core.
Figure 2.13 displays the most prominent effects
involved in full waveform ultrasonic core logging.
Gravity core GeoB1510-2 from the western
equatorial South Atlantic serves as an example. The
lithology controlled single traces and amplitude
spectra demonstrate the influence of increasing
grain sizes on attenuation and frequency content
of transmission seismograms. Compared to a
reference signal in distilled water, the signal shape
remains almost unchanged in case of wave
propagation in fine-grained clayey sediments (1st
attenuated trace). With an increasing amount of
silty and sandy particles the signal amplitudes are
reduced due to an enhanced attenuation of highfrequency components (2nd and 3rd attenuated
trace). This attenuation is accompanied by a
change in signal shape, an effect which is
particularly obvious in the normalized wiggle trace
display of the 1 m long core segment. While the
upper part of this segment is composed of finegrained nannofossil ooze, a calcareous foraminiferal turbidite occurs in the lower part. The downward coarsening of the graded bedding causes
successively lower-frequency signals which can
easily be distinguished from the high-frequency
transmission seismograms in the upper fine-grained
part. Additionally, first arrival times are lower in the
coarse-grained turbidite than in fine-grained
nannofossil oozes indicating higher velocities in
silty and sandy sediments than in the clayey part.
A conversion of the normalized wiggle traces to a
gray-shaded pixel graphic allows us to present the
full transmission seismogram information on a
handy scale. In this ultrasonic image of the
sediment core lithological changes appear as
smooth or sharp phase discontinuities resulting
from the low-frequency waveforms in silty and
sandy layers. Some of these layers indicate a
graded bedding by downward prograding phases
(1.60 - 2.10 m, 4.70 - 4.80 m, 7.50 - 7.60 m). The Pwave velocity and attenuation log analyzed from
the transmission seismograms support the
interpretation. Coarse-grained sandy layers are
characterized by high P-wave velocities and attenuation coefficients while fine-grained parts reveal
low values in both parameters. Especially, attenuation coefficients reflect lithological changes
much more sensitively than P-wave velocities.
While P-wave velocities are determined online
during core logging using a cross-correlation
technique for the first arrival detection (Breitzke
and Spieß 1993)
liner
liner
outside
P
t
t
d
d
v
2
2
−
−
=
(2.19)
(d outside = outer core diameter, 2 d liner = double
liner wall thickness, t = detected first arrival,
2t liner = travel time across both liner walls),
attenuation coefficients are analyzed by a postprocessing routine. Several notches in the amplitude spectra of the transmission seismograms
caused by the resonance characteristics of the
ultrasonic transducers required a modification of
standard attenuation analysis techniques (e.g.
Jannsen et al. 1985; Tonn 1989, 1991). Here, a
modification of the spectral ratio method is
applied (Breitzke et al. 1996). It defines a window
of bandwidth (b i = f ui - f li ) in which the spectral
amplitudes are summed (Fig. 2.14a).
(
)
( )
∑
=
=
ui
li
i
f
f
f
i
mi
x
f
A
x
f
A
,
,
(2.20)
The resulting value ( A f x
mi
( , ) ) is related to
that part of the frequency band which predominantly contributes to the spectral sum, i.e. to the
arithmetic mean frequency (f mi ) of the spectral
amplitude distribution within the i
th
band. Subsequently, for a continuously moving window a
series of attenuation coefficients (α(f mi )) is computed from the natural logarithm of the spectral
ratio of the attenuated and reference signal
( )
(
)
(
)
n
mi
ref
mi
mi
f
k
x
x
f
A
x
f
A
f
⋅
=
⎥
⎥
⎦
⎤
⎢
⎢
⎣
⎡
=
,
,
ln
α
(2.21)
Plotted in a log α - log f diagram the power (n)
and logarithmic attenuation factor (log k) can be
determined from the slope and intercept of a linear
least square fit to the series of (f mi ,α(f mi )) pairs
(Fig. 2.14b). Finally, a smoothed attenuation
coefficient α(f) = k ⋅ f
n
is calculated for the
frequency (f) using these values for (k) and (n).
Figure 2.14b shows several attenuation curves
(α(f mi )) analyzed along the turbidite layer of core
GeoB1510-2. With downward-coarsening grain
sizes attenuation coefficients increase. Each linear
regression to one of these curves provide a power
(n) and attenuation factor (k), and thus one value
α = k ⋅ f
n
on the attenuation log of the complete
core (Fig. 2.14c).
2.4
Acoustic and Elastic Properties