

15 Conceptual Models and Computer Models
542
preferably performed as ‘secondary redox reactions’. Moreover, the adsorption of ammonium,
and the precipitation/dissolution of iron carbonate, manganese carbonate, and iron sulfide can
be included. For all these reactions, the analyst is
able and required to select the adequate rates.
This is where the general problems in applying such models occur: with all the parameters
and boundary conditions that need to be set,
there will be so many ‘buttons’ and control
options ultimately allowing for almost any kind
of modeling of the measured data. Only if so
many examples are available as Wang and Van
Cappellen (1996) found in the data of Canfield et
al. (1993a, b) based on measurements, will it be
possible to come to substantial and reasonable
results. Figure 15.17 shows concentration
profiles for O 2 , NO 3
-
, NH 4
+
, Mn
2+
, Fe
2+
measured
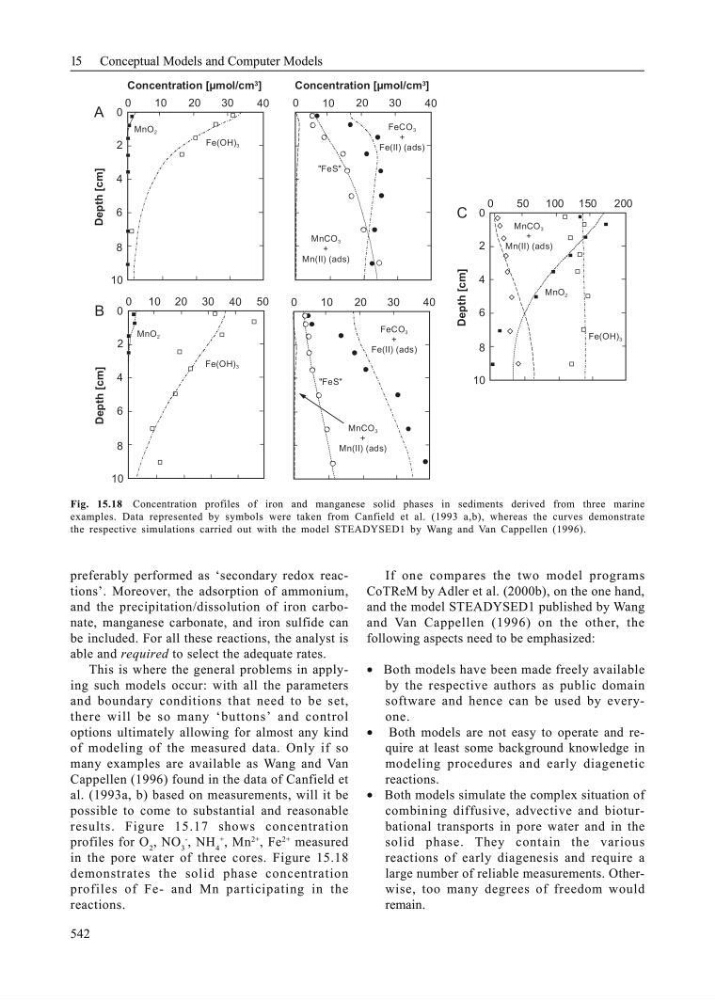
in the pore water of three cores. Figure 15.18
demonstrates the solid phase concentration
profiles of Fe- and Mn participating in the
reactions.
If one compares the two model programs
CoTReM by Adler et al. (2000b), on the one hand,
and the model STEADYSED1 published by Wang
and Van Cappellen (1996) on the other, the
following aspects need to be emphasized:
• Both models have been made freely available
by the respective authors as public domain
software and hence can be used by everyone.
• Both models are not easy to operate and require at least some background knowledge in
modeling procedures and early diagenetic
reactions.
• Both models simulate the complex situation of
combining diffusive, advective and bioturbational transports in pore water and in the
solid phase. They contain the various
reactions of early diagenesis and require a
large number of reliable measurements. Otherwise, too many degrees of freedom would
remain.
0
10
20
30
40
FeCO 3
+
Fe(II) (ads)
Concentration [µmol/cm 3 ]
MnCO 3
+
Mn(II) (ads)
"FeS"
0
10
20
30
40
"FeS"
FeCO 3
+
Fe(II) (ads)
MnCO 3
+
Mn(II) (ads)
0
10
20
30
40
0
2
4
6
8
10
Depth [cm]
Fe(OH) 3
Concentration [µmol/cm 3 ]
A
MnO 2
0
50
100 150
200
0
2
4
6
8
10
Depth [cm]
Fe(OH) 3
C
MnO 2
MnCO 3
+
Mn(II) (ads)
0
10 20 30 40
0
2
4
6
8
10
Depth [cm]
Fe(OH) 3
B
MnO 2
50
Fig. 15.18 Concentration profiles of iron and manganese solid phases in sediments derived from three marine
examples. Data represented by symbols were taken from Canfield et al. (1993 a,b), whereas the curves demonstrate
the respective simulations carried out with the model STEADYSED1 by Wang and Van Cappellen (1996).
542
preferably performed as ‘secondary redox reactions’. Moreover, the adsorption of ammonium,
and the precipitation/dissolution of iron carbonate, manganese carbonate, and iron sulfide can
be included. For all these reactions, the analyst is
able and required to select the adequate rates.
This is where the general problems in applying such models occur: with all the parameters
and boundary conditions that need to be set,
there will be so many ‘buttons’ and control
options ultimately allowing for almost any kind
of modeling of the measured data. Only if so
many examples are available as Wang and Van
Cappellen (1996) found in the data of Canfield et
al. (1993a, b) based on measurements, will it be
possible to come to substantial and reasonable
results. Figure 15.17 shows concentration
profiles for O 2 , NO 3
-
, NH 4
+
, Mn
2+
, Fe
2+
measured
in the pore water of three cores. Figure 15.18
demonstrates the solid phase concentration
profiles of Fe- and Mn participating in the
reactions.
If one compares the two model programs
CoTReM by Adler et al. (2000b), on the one hand,
and the model STEADYSED1 published by Wang
and Van Cappellen (1996) on the other, the
following aspects need to be emphasized:
• Both models have been made freely available
by the respective authors as public domain
software and hence can be used by everyone.
• Both models are not easy to operate and require at least some background knowledge in
modeling procedures and early diagenetic
reactions.
• Both models simulate the complex situation of
combining diffusive, advective and bioturbational transports in pore water and in the
solid phase. They contain the various
reactions of early diagenesis and require a
large number of reliable measurements. Otherwise, too many degrees of freedom would
remain.
0
10
20
30
40
FeCO 3
+
Fe(II) (ads)
Concentration [µmol/cm 3 ]
MnCO 3
+
Mn(II) (ads)
"FeS"
0
10
20
30
40
"FeS"
FeCO 3
+
Fe(II) (ads)
MnCO 3
+
Mn(II) (ads)
0
10
20
30
40
0
2
4
6
8
10
Depth [cm]
Fe(OH) 3
Concentration [µmol/cm 3 ]
A
MnO 2
0
50
100 150
200
0
2
4
6
8
10
Depth [cm]
Fe(OH) 3
C
MnO 2
MnCO 3
+
Mn(II) (ads)
0
10 20 30 40
0
2
4
6
8
10
Depth [cm]
Fe(OH) 3
B
MnO 2
50
Fig. 15.18 Concentration profiles of iron and manganese solid phases in sediments derived from three marine
examples. Data represented by symbols were taken from Canfield et al. (1993 a,b), whereas the curves demonstrate
the respective simulations carried out with the model STEADYSED1 by Wang and Van Cappellen (1996).