

15 Conceptual Models and Computer Models
540
dual processes. In this regard CoTReM permits
modeling to start with the maximum turnover rates,
which the program subsequently reduces to
realistic values. As some of the reactions interact with each other, the adjustment of the model
to the concentration profiles of the single parameters often involves a laborious process of
step-by-step procedure that requires a repeated
subsequent correction of the depth-related
turnover rates. However, there is no other way
which could be better and especially easier to
understand the complex interacting system of
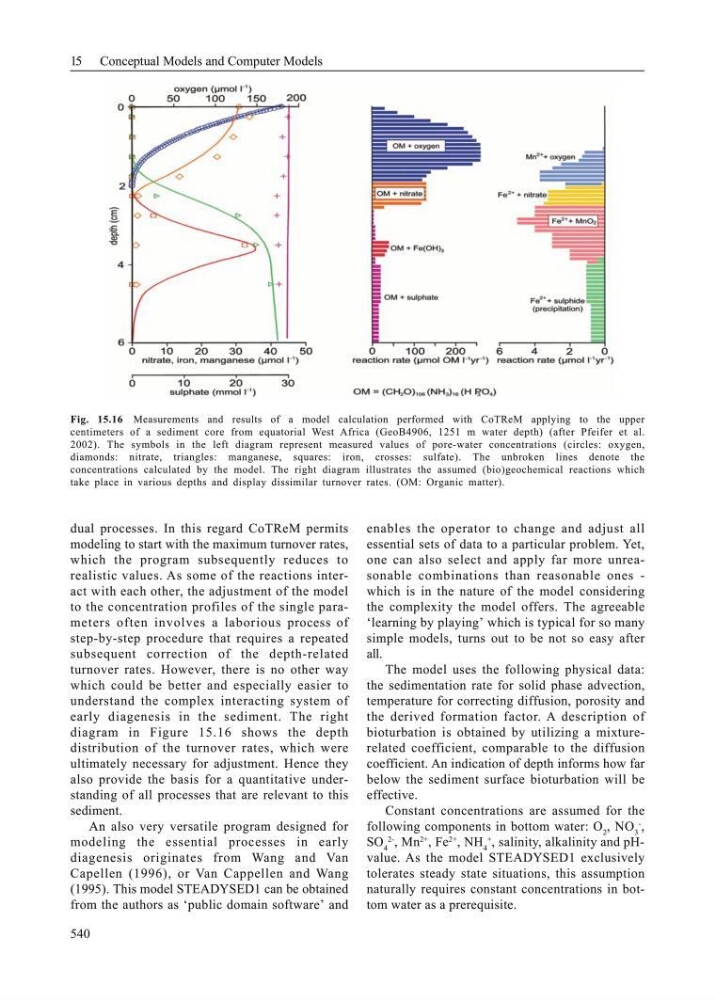
early diagenesis in the sediment. The right
diagram in Figure 15.16 shows the depth
distribution of the turnover rates, which were
ultimately necessary for adjustment. Hence they
also provide the basis for a quantitative understanding of all processes that are relevant to this
sediment.
An also very versatile program designed for
modeling the essential processes in early
diagenesis originates from Wang and Van
Capellen (1996), or Van Cappellen and Wang
(1995). This model STEADYSED1 can be obtained
from the authors as ‘public domain software’ and
enables the operator to change and adjust all
essential sets of data to a particular problem. Yet,
one can also select and apply far more unreasonable combinations than reasonable ones -
which is in the nature of the model considering
the complexity the model offers. The agreeable
‘learning by playing’ which is typical for so many
simple models, turns out to be not so easy after
all.
The model uses the following physical data:
the sedimentation rate for solid phase advection,
temperature for correcting diffusion, porosity and
the derived formation factor. A description of
bioturbation is obtained by utilizing a mixturerelated coefficient, comparable to the diffusion
coefficient. An indication of depth informs how far
below the sediment surface bioturbation will be
effective.
Constant concentrations are assumed for the
following components in bottom water: O 2 , NO 3
-
,
SO 4
2, Mn
2+
, Fe
2+
, NH 4
+
, salinity, alkalinity and pHvalue. As the model STEADYSED1 exclusively
tolerates steady state situations, this assumption
naturally requires constant concentrations in bottom water as a prerequisite.
Fig. 15.16 Measurements and results of a model calculation performed with CoTReM applying to the upper
centimeters of a sediment core from equatorial West Africa (GeoB4906, 1251 m water depth) (after Pfeifer et al.
2002). The symbols in the left diagram represent measured values of pore-water concentrations (circles: oxygen,
diamonds: nitrate, triangles: manganese, squares: iron, crosses: sulfate). The unbroken lines denote the
concentrations calculated by the model. The right diagram illustrates the assumed (bio)geochemical reactions which
take place in various depths and display dissimilar turnover rates. (OM: Organic matter).
540
dual processes. In this regard CoTReM permits
modeling to start with the maximum turnover rates,
which the program subsequently reduces to
realistic values. As some of the reactions interact with each other, the adjustment of the model
to the concentration profiles of the single parameters often involves a laborious process of
step-by-step procedure that requires a repeated
subsequent correction of the depth-related
turnover rates. However, there is no other way
which could be better and especially easier to
understand the complex interacting system of
early diagenesis in the sediment. The right
diagram in Figure 15.16 shows the depth
distribution of the turnover rates, which were
ultimately necessary for adjustment. Hence they
also provide the basis for a quantitative understanding of all processes that are relevant to this
sediment.
An also very versatile program designed for
modeling the essential processes in early
diagenesis originates from Wang and Van
Capellen (1996), or Van Cappellen and Wang
(1995). This model STEADYSED1 can be obtained
from the authors as ‘public domain software’ and
enables the operator to change and adjust all
essential sets of data to a particular problem. Yet,
one can also select and apply far more unreasonable combinations than reasonable ones -
which is in the nature of the model considering
the complexity the model offers. The agreeable
‘learning by playing’ which is typical for so many
simple models, turns out to be not so easy after
all.
The model uses the following physical data:
the sedimentation rate for solid phase advection,
temperature for correcting diffusion, porosity and
the derived formation factor. A description of
bioturbation is obtained by utilizing a mixturerelated coefficient, comparable to the diffusion
coefficient. An indication of depth informs how far
below the sediment surface bioturbation will be
effective.
Constant concentrations are assumed for the
following components in bottom water: O 2 , NO 3
-
,
SO 4
2, Mn
2+
, Fe
2+
, NH 4
+
, salinity, alkalinity and pHvalue. As the model STEADYSED1 exclusively
tolerates steady state situations, this assumption
naturally requires constant concentrations in bottom water as a prerequisite.
Fig. 15.16 Measurements and results of a model calculation performed with CoTReM applying to the upper
centimeters of a sediment core from equatorial West Africa (GeoB4906, 1251 m water depth) (after Pfeifer et al.
2002). The symbols in the left diagram represent measured values of pore-water concentrations (circles: oxygen,
diamonds: nitrate, triangles: manganese, squares: iron, crosses: sulfate). The unbroken lines denote the
concentrations calculated by the model. The right diagram illustrates the assumed (bio)geochemical reactions which
take place in various depths and display dissimilar turnover rates. (OM: Organic matter).