

15 Conceptual Models and Computer Models
536
Starting out from this profile of initial concentrations, we then only introduced the timecorrect diffusion in the model calculation, along
with a correct diffusion coefficient, and the mutual degradation of sulfate and methane at the
sulfate-methane transition zone.
First, the minor, randomly occurring differences between adjoining points were ‘smoothed
out’ in the course of model calculation. At the
same time, the upper part of the profile adapted
more and more to the ocean water transition,
while the lower part adapted to the low concentration of the sulfate-methane transition zone.
After somewhat more than 20 years, an almost
perfect adjustment to the measured profile was
achieved without any other fitting technique
(center diagram in Fig. 15.12). This core was
obtained in 1994, and the sulfate profile was
measured in the same year. The sediment avalanche consequently took place in the early 70s
of the last century. The right diagram in Figure
15.12 shows the same profile model as it would
look like in 500 years after the event. A new,
almost stationary condition will be reached after
this time, and only a faint suggestion of the Sshaped curve typical of the non-steady state
condition will still remain recognizable.
Example 4: Formation of phosphorite in shelf
sediments
It has been recently demonstrated in shelf sediments of the highly productive upwelling area off
the coast of Namibia that certain sulfur bacteria
release very high concentrations of phosphate into
the pore water near the sediment surface. This
produces a stratified precipitation of phosphorite
minerals (Schulz and Schulz 2005). The questions
to be answered by modeling are as follows:
• At which phosphate concentration must we
expect the precipitation of which minerals ?
• The concentrations in pore water at a depth
of only one centimeter below the sediment
surface are considered as stationary. What
release rates applying to phosphate must we
postulate for the bacteria if it is known from
experiments that the precipitation kinetics of
phosphate minerals are in a certain range,
and if the measured concentration profile in
pore water is to be simulated correctly?
• How much time does it take for sulfur bacteria
to release these phosphate concentrations till
the amounts of phosphate found in the solid
phase of the sediment accumulated ?
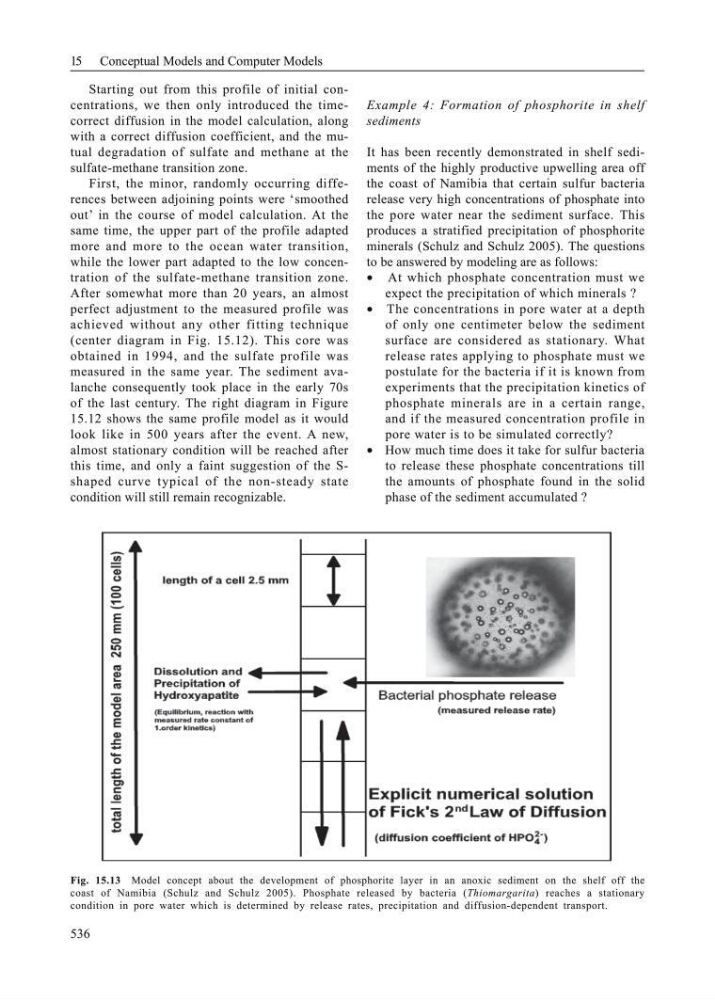
Fig. 15.13 Model concept about the development of phosphorite layer in an anoxic sediment on the shelf off the
coast of Namibia (Schulz and Schulz 2005). Phosphate released by bacteria (Thiomargarita) reaches a stationary
condition in pore water which is determined by release rates, precipitation and diffusion-dependent transport.
536
Starting out from this profile of initial concentrations, we then only introduced the timecorrect diffusion in the model calculation, along
with a correct diffusion coefficient, and the mutual degradation of sulfate and methane at the
sulfate-methane transition zone.
First, the minor, randomly occurring differences between adjoining points were ‘smoothed
out’ in the course of model calculation. At the
same time, the upper part of the profile adapted
more and more to the ocean water transition,
while the lower part adapted to the low concentration of the sulfate-methane transition zone.
After somewhat more than 20 years, an almost
perfect adjustment to the measured profile was
achieved without any other fitting technique
(center diagram in Fig. 15.12). This core was
obtained in 1994, and the sulfate profile was
measured in the same year. The sediment avalanche consequently took place in the early 70s
of the last century. The right diagram in Figure
15.12 shows the same profile model as it would
look like in 500 years after the event. A new,
almost stationary condition will be reached after
this time, and only a faint suggestion of the Sshaped curve typical of the non-steady state
condition will still remain recognizable.
Example 4: Formation of phosphorite in shelf
sediments
It has been recently demonstrated in shelf sediments of the highly productive upwelling area off
the coast of Namibia that certain sulfur bacteria
release very high concentrations of phosphate into
the pore water near the sediment surface. This
produces a stratified precipitation of phosphorite
minerals (Schulz and Schulz 2005). The questions
to be answered by modeling are as follows:
• At which phosphate concentration must we
expect the precipitation of which minerals ?
• The concentrations in pore water at a depth
of only one centimeter below the sediment
surface are considered as stationary. What
release rates applying to phosphate must we
postulate for the bacteria if it is known from
experiments that the precipitation kinetics of
phosphate minerals are in a certain range,
and if the measured concentration profile in
pore water is to be simulated correctly?
• How much time does it take for sulfur bacteria
to release these phosphate concentrations till
the amounts of phosphate found in the solid
phase of the sediment accumulated ?
Fig. 15.13 Model concept about the development of phosphorite layer in an anoxic sediment on the shelf off the
coast of Namibia (Schulz and Schulz 2005). Phosphate released by bacteria (Thiomargarita) reaches a stationary
condition in pore water which is determined by release rates, precipitation and diffusion-dependent transport.