

537
• How fast or slow is the phosphate mineral
layer embedded in the sediment re-dissolved
if phosphate concentrations increasing in
the process of dissolution return to the
ocean water by diffusion ?
Figure 15.13 shows the principle structure of the
model which is supposed to give an answer to
these questions. Here, realization was done in
accordance with the explicit solution and the TwoStep Method using an Excel
®
worksheet, which can
also be downloaded from the above mentioned
website, along with other relevant information.
The model will record the upper 25 centimeters
of the sediment if there are 100 cells each measuring a length of merely 2.5 mm. This accounts
for a sufficiently good depth resolution in the
interesting range of reactions, and it reaches deep
enough so that the sensitive lower margin of the
model is by no means influenced by the processes
running inside the model. Apart from the timecorrect diffusion of dissolved phosphate, a ratecontrolled input (bacterial release of phosphate
into the pore water fraction) and a rate-controlled
output (precipitation of a phosphate mineral) are
accounted for. Simultaneously all precipitations
and dissolutions had to be recorded so that the
total of precipitated phosphate could be compared
with the sedimentary contents found in nature.
The input was only given for cells in which the
presence of these large sulfur bacteria of the
genus Thiomargarita that are even easily visible
with the naked eye has been known to exist at the
respective sediment depths. Precipitation of the
mineral hydroxyapatite [Ca 5 OH(PO 4 ) 3 ] was conducted with first-order kinetics as soon as the
saturation concentration (40 µmol l
-1
phosphate)
was exceeded. This concentration resulted from
model calculations performed with the program
PHREEQC (Section 15.1.2) on this mineral which is
characteristic for such conditions and whose
presence in this sediment appeared to be likely on
account of x-ray diffractometry (XRD).
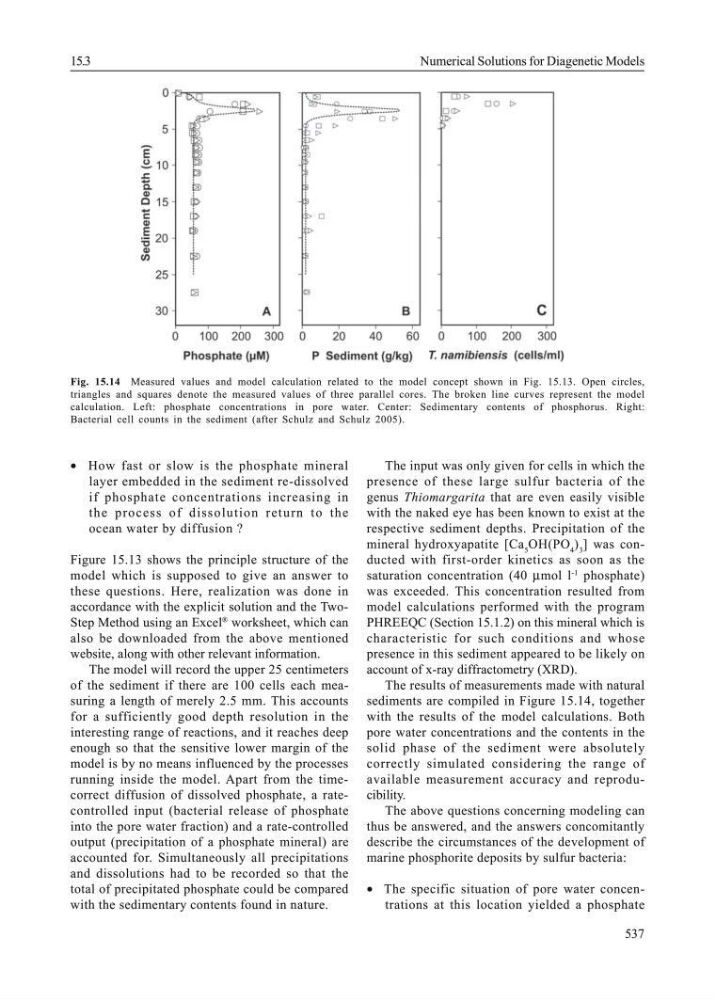
The results of measurements made with natural
sediments are compiled in Figure 15.14, together
with the results of the model calculations. Both
pore water concentrations and the contents in the
solid phase of the sediment were absolutely
correctly simulated considering the range of
available measurement accuracy and reproducibility.
The above questions concerning modeling can
thus be answered, and the answers concomitantly
describe the circumstances of the development of
marine phosphorite deposits by sulfur bacteria:
• The specific situation of pore water concentrations at this location yielded a phosphate
Fig. 15.14 Measured values and model calculation related to the model concept shown in Fig. 15.13. Open circles,
triangles and squares denote the measured values of three parallel cores. The broken line curves represent the model
calculation. Left: phosphate concentrations in pore water. Center: Sedimentary contents of phosphorus. Right:
Bacterial cell counts in the sediment (after Schulz and Schulz 2005).
15.3
Numerical Solutions for Diagenetic Models
• How fast or slow is the phosphate mineral
layer embedded in the sediment re-dissolved
if phosphate concentrations increasing in
the process of dissolution return to the
ocean water by diffusion ?
Figure 15.13 shows the principle structure of the
model which is supposed to give an answer to
these questions. Here, realization was done in
accordance with the explicit solution and the TwoStep Method using an Excel
®
worksheet, which can
also be downloaded from the above mentioned
website, along with other relevant information.
The model will record the upper 25 centimeters
of the sediment if there are 100 cells each measuring a length of merely 2.5 mm. This accounts
for a sufficiently good depth resolution in the
interesting range of reactions, and it reaches deep
enough so that the sensitive lower margin of the
model is by no means influenced by the processes
running inside the model. Apart from the timecorrect diffusion of dissolved phosphate, a ratecontrolled input (bacterial release of phosphate
into the pore water fraction) and a rate-controlled
output (precipitation of a phosphate mineral) are
accounted for. Simultaneously all precipitations
and dissolutions had to be recorded so that the
total of precipitated phosphate could be compared
with the sedimentary contents found in nature.
The input was only given for cells in which the
presence of these large sulfur bacteria of the
genus Thiomargarita that are even easily visible
with the naked eye has been known to exist at the
respective sediment depths. Precipitation of the
mineral hydroxyapatite [Ca 5 OH(PO 4 ) 3 ] was conducted with first-order kinetics as soon as the
saturation concentration (40 µmol l
-1
phosphate)
was exceeded. This concentration resulted from
model calculations performed with the program
PHREEQC (Section 15.1.2) on this mineral which is
characteristic for such conditions and whose
presence in this sediment appeared to be likely on
account of x-ray diffractometry (XRD).
The results of measurements made with natural
sediments are compiled in Figure 15.14, together
with the results of the model calculations. Both
pore water concentrations and the contents in the
solid phase of the sediment were absolutely
correctly simulated considering the range of
available measurement accuracy and reproducibility.
The above questions concerning modeling can
thus be answered, and the answers concomitantly
describe the circumstances of the development of
marine phosphorite deposits by sulfur bacteria:
• The specific situation of pore water concentrations at this location yielded a phosphate
Fig. 15.14 Measured values and model calculation related to the model concept shown in Fig. 15.13. Open circles,
triangles and squares denote the measured values of three parallel cores. The broken line curves represent the model
calculation. Left: phosphate concentrations in pore water. Center: Sedimentary contents of phosphorus. Right:
Bacterial cell counts in the sediment (after Schulz and Schulz 2005).
15.3
Numerical Solutions for Diagenetic Models