

535
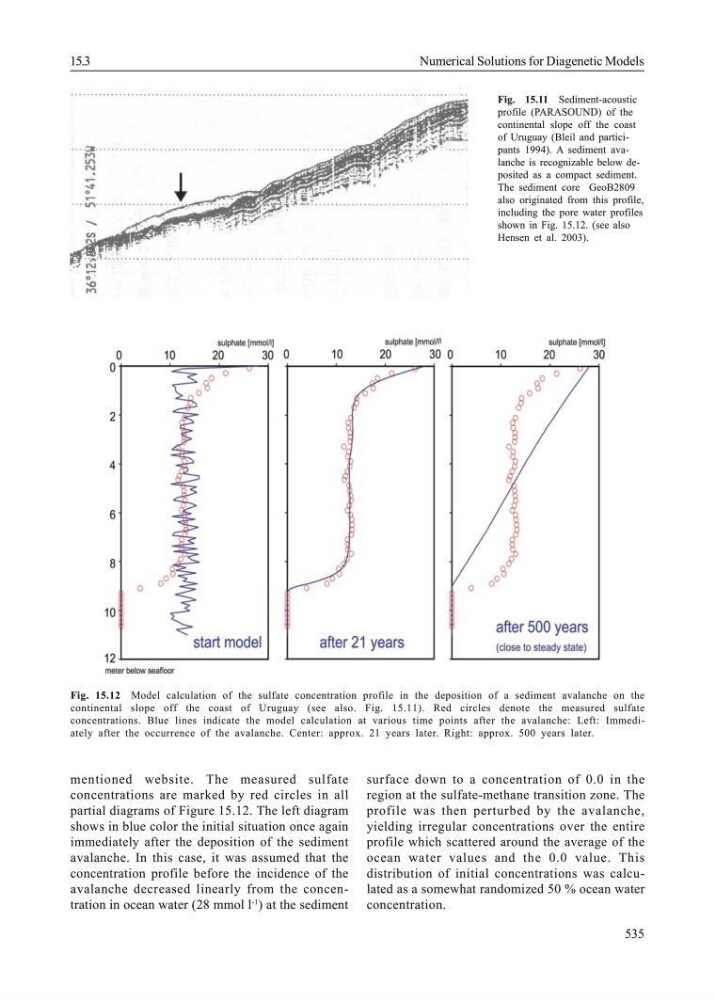
mentioned website. The measured sulfate
concentrations are marked by red circles in all
partial diagrams of Figure 15.12. The left diagram
shows in blue color the initial situation once again
immediately after the deposition of the sediment
avalanche. In this case, it was assumed that the
concentration profile before the incidence of the
avalanche decreased linearly from the concentration in ocean water (28 mmol l
-1
) at the sediment
surface down to a concentration of 0.0 in the
region at the sulfate-methane transition zone. The
profile was then perturbed by the avalanche,
yielding irregular concentrations over the entire
profile which scattered around the average of the
ocean water values and the 0.0 value. This
distribution of initial concentrations was calculated as a somewhat randomized 50 % ocean water
concentration.
Fig. 15.11 Sediment-acoustic
profile (PARASOUND) of the
continental slope off the coast
of Uruguay (Bleil and participants 1994). A sediment avalanche is recognizable below deposited as a compact sediment.
The sediment core GeoB2809
also originated from this profile,
including the pore water profiles
shown in Fig. 15.12. (see also
Hensen et al. 2003).
Fig. 15.12 Model calculation of the sulfate concentration profile in the deposition of a sediment avalanche on the
continental slope off the coast of Uruguay (see also. Fig. 15.11). Red circles denote the measured sulfate
concentrations. Blue lines indicate the model calculation at various time points after the avalanche: Left: Immediately after the occurrence of the avalanche. Center: approx. 21 years later. Right: approx. 500 years later.
15.3
Numerical Solutions for Diagenetic Models
mentioned website. The measured sulfate
concentrations are marked by red circles in all
partial diagrams of Figure 15.12. The left diagram
shows in blue color the initial situation once again
immediately after the deposition of the sediment
avalanche. In this case, it was assumed that the
concentration profile before the incidence of the
avalanche decreased linearly from the concentration in ocean water (28 mmol l
-1
) at the sediment
surface down to a concentration of 0.0 in the
region at the sulfate-methane transition zone. The
profile was then perturbed by the avalanche,
yielding irregular concentrations over the entire
profile which scattered around the average of the
ocean water values and the 0.0 value. This
distribution of initial concentrations was calculated as a somewhat randomized 50 % ocean water
concentration.
Fig. 15.11 Sediment-acoustic
profile (PARASOUND) of the
continental slope off the coast
of Uruguay (Bleil and participants 1994). A sediment avalanche is recognizable below deposited as a compact sediment.
The sediment core GeoB2809
also originated from this profile,
including the pore water profiles
shown in Fig. 15.12. (see also
Hensen et al. 2003).
Fig. 15.12 Model calculation of the sulfate concentration profile in the deposition of a sediment avalanche on the
continental slope off the coast of Uruguay (see also. Fig. 15.11). Red circles denote the measured sulfate
concentrations. Blue lines indicate the model calculation at various time points after the avalanche: Left: Immediately after the occurrence of the avalanche. Center: approx. 21 years later. Right: approx. 500 years later.
15.3
Numerical Solutions for Diagenetic Models