

15 Conceptual Models and Computer Models
534
sulfate profile for the time span modeled is estimated to be somewhere between 5 to 10 % of this
value.
Example 3: Reconstruction of the date of a sediment
avalanche at the continental slope
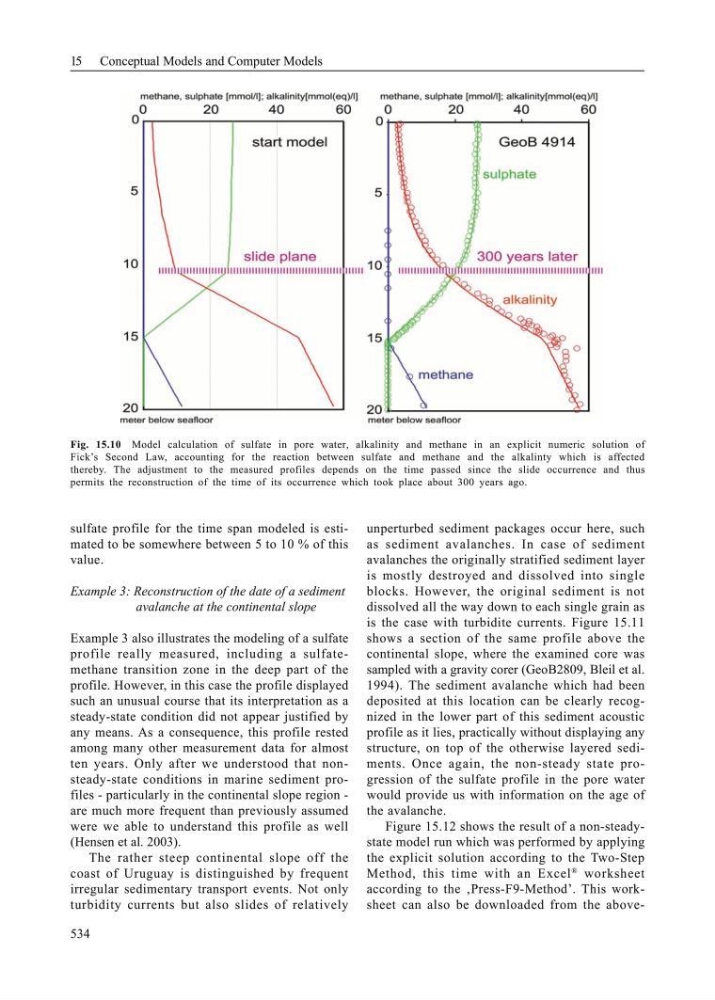
Example 3 also illustrates the modeling of a sulfate
profile really measured, including a sulfatemethane transition zone in the deep part of the
profile. However, in this case the profile displayed
such an unusual course that its interpretation as a
steady-state condition did not appear justified by
any means. As a consequence, this profile rested
among many other measurement data for almost
ten years. Only after we understood that nonsteady-state conditions in marine sediment profiles - particularly in the continental slope region -
are much more frequent than previously assumed
were we able to understand this profile as well
(Hensen et al. 2003).
The rather steep continental slope off the
coast of Uruguay is distinguished by frequent
irregular sedimentary transport events. Not only
turbidity currents but also slides of relatively
unperturbed sediment packages occur here, such
as sediment avalanches. In case of sediment
avalanches the originally stratified sediment layer
is mostly destroyed and dissolved into single
blocks. However, the original sediment is not
dissolved all the way down to each single grain as
is the case with turbidite currents. Figure 15.11
shows a section of the same profile above the
continental slope, where the examined core was
sampled with a gravity corer (GeoB2809, Bleil et al.
1994). The sediment avalanche which had been
deposited at this location can be clearly recognized in the lower part of this sediment acoustic
profile as it lies, practically without displaying any
structure, on top of the otherwise layered sediments. Once again, the non-steady state progression of the sulfate profile in the pore water
would provide us with information on the age of
the avalanche.
Figure 15.12 shows the result of a non-steadystate model run which was performed by applying
the explicit solution according to the Two-Step
Method, this time with an Excel
®
worksheet
according to the ‚Press-F9-Method’. This worksheet can also be downloaded from the aboveFig. 15.10 Model calculation of sulfate in pore water, alkalinity and methane in an explicit numeric solution of
Fick’s Second Law, accounting for the reaction between sulfate and methane and the alkalinty which is affected
thereby. The adjustment to the measured profiles depends on the time passed since the slide occurrence and thus
permits the reconstruction of the time of its occurrence which took place about 300 years ago.
534
sulfate profile for the time span modeled is estimated to be somewhere between 5 to 10 % of this
value.
Example 3: Reconstruction of the date of a sediment
avalanche at the continental slope
Example 3 also illustrates the modeling of a sulfate
profile really measured, including a sulfatemethane transition zone in the deep part of the
profile. However, in this case the profile displayed
such an unusual course that its interpretation as a
steady-state condition did not appear justified by
any means. As a consequence, this profile rested
among many other measurement data for almost
ten years. Only after we understood that nonsteady-state conditions in marine sediment profiles - particularly in the continental slope region -
are much more frequent than previously assumed
were we able to understand this profile as well
(Hensen et al. 2003).
The rather steep continental slope off the
coast of Uruguay is distinguished by frequent
irregular sedimentary transport events. Not only
turbidity currents but also slides of relatively
unperturbed sediment packages occur here, such
as sediment avalanches. In case of sediment
avalanches the originally stratified sediment layer
is mostly destroyed and dissolved into single
blocks. However, the original sediment is not
dissolved all the way down to each single grain as
is the case with turbidite currents. Figure 15.11
shows a section of the same profile above the
continental slope, where the examined core was
sampled with a gravity corer (GeoB2809, Bleil et al.
1994). The sediment avalanche which had been
deposited at this location can be clearly recognized in the lower part of this sediment acoustic
profile as it lies, practically without displaying any
structure, on top of the otherwise layered sediments. Once again, the non-steady state progression of the sulfate profile in the pore water
would provide us with information on the age of
the avalanche.
Figure 15.12 shows the result of a non-steadystate model run which was performed by applying
the explicit solution according to the Two-Step
Method, this time with an Excel
®
worksheet
according to the ‚Press-F9-Method’. This worksheet can also be downloaded from the aboveFig. 15.10 Model calculation of sulfate in pore water, alkalinity and methane in an explicit numeric solution of
Fick’s Second Law, accounting for the reaction between sulfate and methane and the alkalinty which is affected
thereby. The adjustment to the measured profiles depends on the time passed since the slide occurrence and thus
permits the reconstruction of the time of its occurrence which took place about 300 years ago.