

533
A solution to this problem is only gained when
this profile is interpreted as a non-state condition
(Zabel and Schulz 2001), assuming that in recent
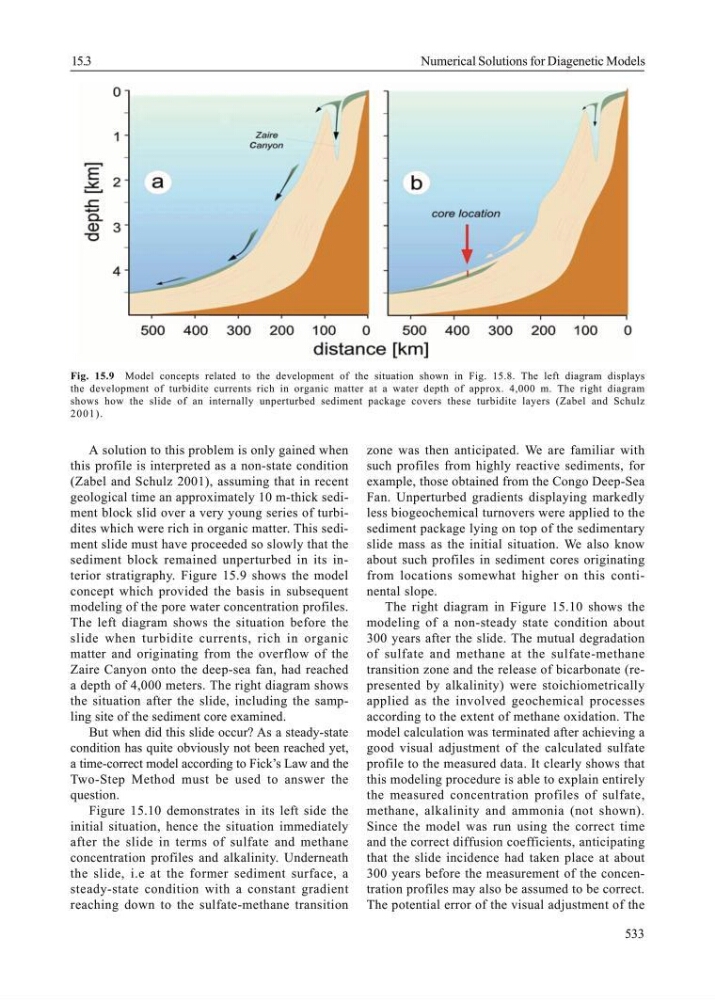
geological time an approximately 10 m-thick sediment block slid over a very young series of turbidites which were rich in organic matter. This sediment slide must have proceeded so slowly that the
sediment block remained unperturbed in its interior stratigraphy. Figure 15.9 shows the model
concept which provided the basis in subsequent
modeling of the pore water concentration profiles.
The left diagram shows the situation before the
slide when turbidite currents, rich in organic
matter and originating from the overflow of the
Zaire Canyon onto the deep-sea fan, had reached
a depth of 4,000 meters. The right diagram shows
the situation after the slide, including the sampling site of the sediment core examined.
But when did this slide occur? As a steady-state
condition has quite obviously not been reached yet,
a time-correct model according to Fick’s Law and the
Two-Step Method must be used to answer the
question.
Figure 15.10 demonstrates in its left side the
initial situation, hence the situation immediately
after the slide in terms of sulfate and methane
concentration profiles and alkalinity. Underneath
the slide, i.e at the former sediment surface, a
steady-state condition with a constant gradient
reaching down to the sulfate-methane transition
zone was then anticipated. We are familiar with
such profiles from highly reactive sediments, for
example, those obtained from the Congo Deep-Sea
Fan. Unperturbed gradients displaying markedly
less biogeochemical turnovers were applied to the
sediment package lying on top of the sedimentary
slide mass as the initial situation. We also know
about such profiles in sediment cores originating
from locations somewhat higher on this continental slope.
The right diagram in Figure 15.10 shows the
modeling of a non-steady state condition about
300 years after the slide. The mutual degradation
of sulfate and methane at the sulfate-methane
transition zone and the release of bicarbonate (represented by alkalinity) were stoichiometrically
applied as the involved geochemical processes
according to the extent of methane oxidation. The
model calculation was terminated after achieving a
good visual adjustment of the calculated sulfate
profile to the measured data. It clearly shows that
this modeling procedure is able to explain entirely
the measured concentration profiles of sulfate,
methane, alkalinity and ammonia (not shown).
Since the model was run using the correct time
and the correct diffusion coefficients, anticipating
that the slide incidence had taken place at about
300 years before the measurement of the concentration profiles may also be assumed to be correct.
The potential error of the visual adjustment of the
Fig. 15.9 Model concepts related to the development of the situation shown in Fig. 15.8. The left diagram displays
the development of turbidite currents rich in organic matter at a water depth of approx. 4,000 m. The right diagram
shows how the slide of an internally unperturbed sediment package covers these turbidite layers (Zabel and Schulz
2001).
15.3
Numerical Solutions for Diagenetic Models
A solution to this problem is only gained when
this profile is interpreted as a non-state condition
(Zabel and Schulz 2001), assuming that in recent
geological time an approximately 10 m-thick sediment block slid over a very young series of turbidites which were rich in organic matter. This sediment slide must have proceeded so slowly that the
sediment block remained unperturbed in its interior stratigraphy. Figure 15.9 shows the model
concept which provided the basis in subsequent
modeling of the pore water concentration profiles.
The left diagram shows the situation before the
slide when turbidite currents, rich in organic
matter and originating from the overflow of the
Zaire Canyon onto the deep-sea fan, had reached
a depth of 4,000 meters. The right diagram shows
the situation after the slide, including the sampling site of the sediment core examined.
But when did this slide occur? As a steady-state
condition has quite obviously not been reached yet,
a time-correct model according to Fick’s Law and the
Two-Step Method must be used to answer the
question.
Figure 15.10 demonstrates in its left side the
initial situation, hence the situation immediately
after the slide in terms of sulfate and methane
concentration profiles and alkalinity. Underneath
the slide, i.e at the former sediment surface, a
steady-state condition with a constant gradient
reaching down to the sulfate-methane transition
zone was then anticipated. We are familiar with
such profiles from highly reactive sediments, for
example, those obtained from the Congo Deep-Sea
Fan. Unperturbed gradients displaying markedly
less biogeochemical turnovers were applied to the
sediment package lying on top of the sedimentary
slide mass as the initial situation. We also know
about such profiles in sediment cores originating
from locations somewhat higher on this continental slope.
The right diagram in Figure 15.10 shows the
modeling of a non-steady state condition about
300 years after the slide. The mutual degradation
of sulfate and methane at the sulfate-methane
transition zone and the release of bicarbonate (represented by alkalinity) were stoichiometrically
applied as the involved geochemical processes
according to the extent of methane oxidation. The
model calculation was terminated after achieving a
good visual adjustment of the calculated sulfate
profile to the measured data. It clearly shows that
this modeling procedure is able to explain entirely
the measured concentration profiles of sulfate,
methane, alkalinity and ammonia (not shown).
Since the model was run using the correct time
and the correct diffusion coefficients, anticipating
that the slide incidence had taken place at about
300 years before the measurement of the concentration profiles may also be assumed to be correct.
The potential error of the visual adjustment of the
Fig. 15.9 Model concepts related to the development of the situation shown in Fig. 15.8. The left diagram displays
the development of turbidite currents rich in organic matter at a water depth of approx. 4,000 m. The right diagram
shows how the slide of an internally unperturbed sediment package covers these turbidite layers (Zabel and Schulz
2001).
15.3
Numerical Solutions for Diagenetic Models