

15 Conceptual Models and Computer Models
532
present in the entire profile. But any oxygen
supplied from the bottom water into the sediment
by means of diffusion will be immediately subject
to the already mentioned consumption of oxygen
displaying a half-life of 50 days.
If the sedimentary diffusion coefficient is
given, the position of stationary condition will
then be merely a function of the degradation rate,
hence the half-life assumed in our example. Figure
15.7 illustrates that a concentration profile close
to the stationary condition is reached within a
time period as short as three months. This is the
case even in our example in which the penetration
depth of oxygen is at about 30 cm, and despite the
fact that the initial concentration of 0.0 over the
entire profile is far away from the stationary
condition.
Example 2: Dating a sediment slide
at the continental slope
While the previous example presents a purely theoretical case, Example 2 refers to a real situation
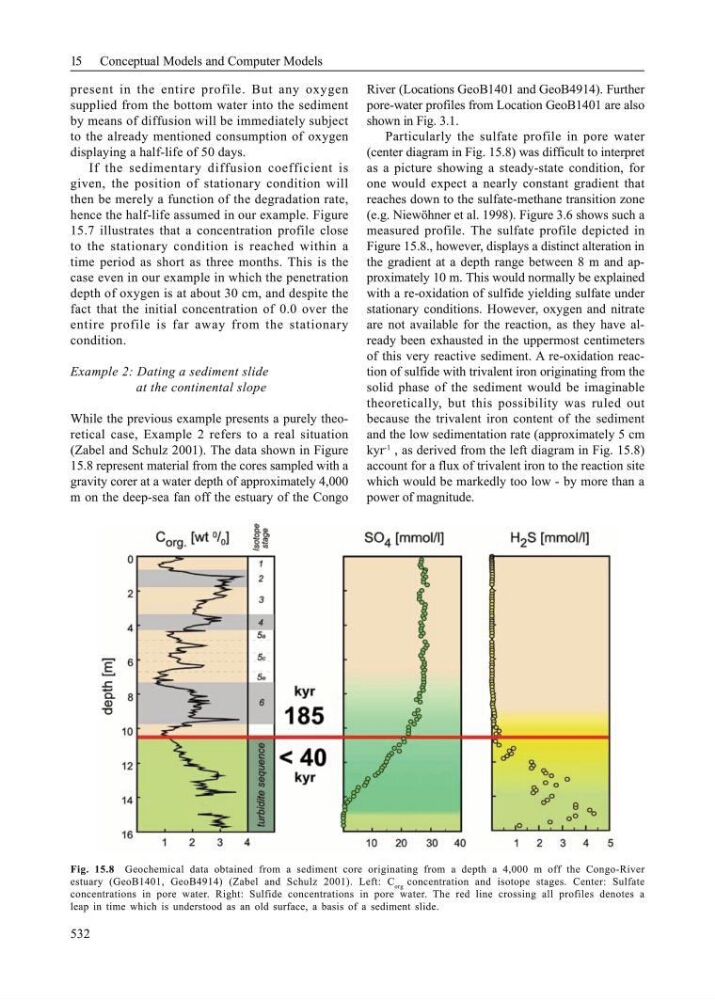
(Zabel and Schulz 2001). The data shown in Figure
15.8 represent material from the cores sampled with a
gravity corer at a water depth of approximately 4,000
m on the deep-sea fan off the estuary of the Congo
River (Locations GeoB1401 and GeoB4914). Further
pore-water profiles from Location GeoB1401 are also
shown in Fig. 3.1.
Particularly the sulfate profile in pore water
(center diagram in Fig. 15.8) was difficult to interpret
as a picture showing a steady-state condition, for
one would expect a nearly constant gradient that
reaches down to the sulfate-methane transition zone
(e.g. Niewöhner et al. 1998). Figure 3.6 shows such a
measured profile. The sulfate profile depicted in
Figure 15.8., however, displays a distinct alteration in
the gradient at a depth range between 8 m and approximately 10 m. This would normally be explained
with a re-oxidation of sulfide yielding sulfate under
stationary conditions. However, oxygen and nitrate
are not available for the reaction, as they have already been exhausted in the uppermost centimeters
of this very reactive sediment. A re-oxidation reaction of sulfide with trivalent iron originating from the
solid phase of the sediment would be imaginable
theoretically, but this possibility was ruled out
because the trivalent iron content of the sediment
and the low sedimentation rate (approximately 5 cm
kyr
-1
, as derived from the left diagram in Fig. 15.8)
account for a flux of trivalent iron to the reaction site
which would be markedly too low - by more than a
power of magnitude.
Fig. 15.8 Geochemical data obtained from a sediment core originating from a depth a 4,000 m off the Congo-River
estuary (GeoB1401, GeoB4914) (Zabel and Schulz 2001). Left: C org concentration and isotope stages. Center: Sulfate
concentrations in pore water. Right: Sulfide concentrations in pore water. The red line crossing all profiles denotes a
leap in time which is understood as an old surface, a basis of a sediment slide.
532
present in the entire profile. But any oxygen
supplied from the bottom water into the sediment
by means of diffusion will be immediately subject
to the already mentioned consumption of oxygen
displaying a half-life of 50 days.
If the sedimentary diffusion coefficient is
given, the position of stationary condition will
then be merely a function of the degradation rate,
hence the half-life assumed in our example. Figure
15.7 illustrates that a concentration profile close
to the stationary condition is reached within a
time period as short as three months. This is the
case even in our example in which the penetration
depth of oxygen is at about 30 cm, and despite the
fact that the initial concentration of 0.0 over the
entire profile is far away from the stationary
condition.
Example 2: Dating a sediment slide
at the continental slope
While the previous example presents a purely theoretical case, Example 2 refers to a real situation
(Zabel and Schulz 2001). The data shown in Figure
15.8 represent material from the cores sampled with a
gravity corer at a water depth of approximately 4,000
m on the deep-sea fan off the estuary of the Congo
River (Locations GeoB1401 and GeoB4914). Further
pore-water profiles from Location GeoB1401 are also
shown in Fig. 3.1.
Particularly the sulfate profile in pore water
(center diagram in Fig. 15.8) was difficult to interpret
as a picture showing a steady-state condition, for
one would expect a nearly constant gradient that
reaches down to the sulfate-methane transition zone
(e.g. Niewöhner et al. 1998). Figure 3.6 shows such a
measured profile. The sulfate profile depicted in
Figure 15.8., however, displays a distinct alteration in
the gradient at a depth range between 8 m and approximately 10 m. This would normally be explained
with a re-oxidation of sulfide yielding sulfate under
stationary conditions. However, oxygen and nitrate
are not available for the reaction, as they have already been exhausted in the uppermost centimeters
of this very reactive sediment. A re-oxidation reaction of sulfide with trivalent iron originating from the
solid phase of the sediment would be imaginable
theoretically, but this possibility was ruled out
because the trivalent iron content of the sediment
and the low sedimentation rate (approximately 5 cm
kyr
-1
, as derived from the left diagram in Fig. 15.8)
account for a flux of trivalent iron to the reaction site
which would be markedly too low - by more than a
power of magnitude.
Fig. 15.8 Geochemical data obtained from a sediment core originating from a depth a 4,000 m off the Congo-River
estuary (GeoB1401, GeoB4914) (Zabel and Schulz 2001). Left: C org concentration and isotope stages. Center: Sulfate
concentrations in pore water. Right: Sulfide concentrations in pore water. The red line crossing all profiles denotes a
leap in time which is understood as an old surface, a basis of a sediment slide.