

521
program PHREEQC will then provide further
detailed information on the distribution of the
aquatic species and all the saturation indices
according to the Tables 15.2 and 15.3, which
presentation, however, was omitted in this context.
Decomposition of Organic Matter
by Oxygen and Nitrate
If certain boundary conditions are maintained,
the application of the model program PHREEQC
leads to options of particular interest, whenever
simulations of one, or several simultaneously
running reactions are carried out. The oxidation of
organic matter by dissolved oxygen - and after it
is consumed, by nitrate - represents a very
important reaction in seawater and especially in
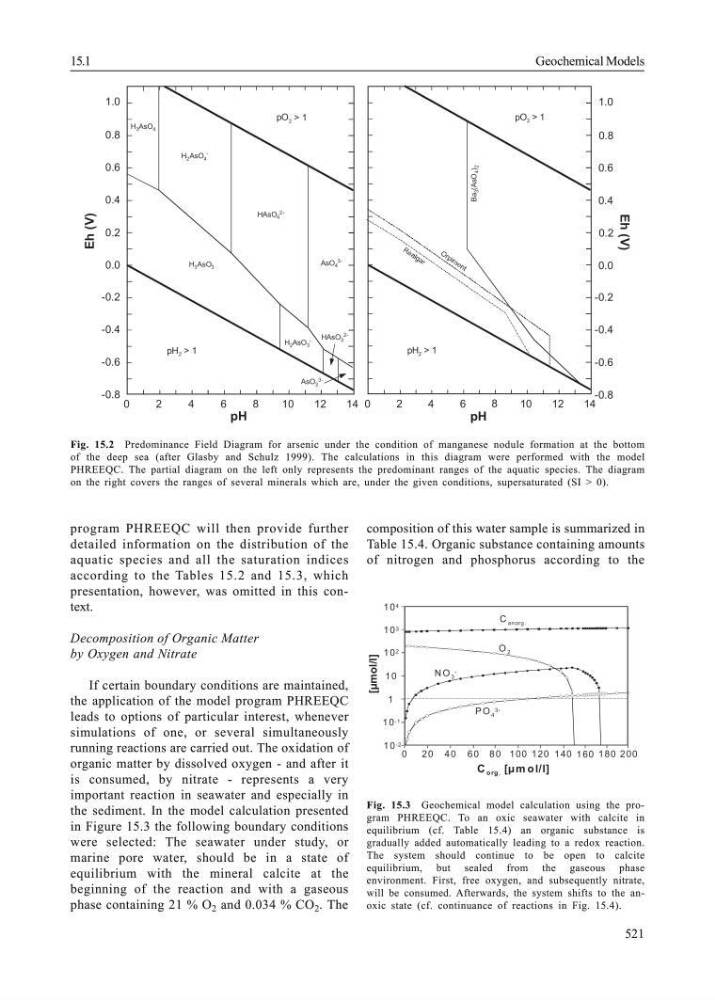
the sediment. In the model calculation presented
in Figure 15.3 the following boundary conditions
were selected: The seawater under study, or
marine pore water, should be in a state of
equilibrium with the mineral calcite at the
beginning of the reaction and with a gaseous
phase containing 21 % O 2 and 0.034 % CO 2 . The
composition of this water sample is summarized in
Table 15.4. Organic substance containing amounts
of nitrogen and phosphorus according to the
Fig. 15.2 Predominance Field Diagram for arsenic under the condition of manganese nodule formation at the bottom
of the deep sea (after Glasby and Schulz 1999). The calculations in this diagram were performed with the model
PHREEQC. The partial diagram on the left only represents the predominant ranges of the aquatic species. The diagram
on the right covers the ranges of several minerals which are, under the given conditions, supersaturated (SI > 0).
Fig. 15.3 Geochemical model calculation using the program PHREEQC. To an oxic seawater with calcite in
equilibrium (cf. Table 15.4) an organic substance is
gradually added automatically leading to a redox reaction.
The system should continue to be open to calcite
equilibrium, but sealed from the gaseous phase
environment. First, free oxygen, and subsequently nitrate,
will be consumed. Afterwards, the system shifts to the anoxic state (cf. continuance of reactions in Fig. 15.4).
15.1
Geochemical Models
pH
0
2
4
6
8
10
12
14
1.0
0.8
0.6
0.4
0.2
0.0
-0.2
-0.4
-0.6
-0.8
Eh (V)
pH 2 > 1
pO 2 > 1
0
2
4
6
8
10
12
14
1.0
0.8
0.6
0.4
0.2
0.0
-0.2
-0.4
-0.6
-0.8
Eh (V)
pH 2 > 1
pO 2 > 1
pH
H 2 AsO 4
-
HAsO 4
2H 3 AsO 4
AsO 4
3H 3 AsO 3
H 2 AsO 3
-
HAsO 3
2AsO 3
3Ba
3 (AsO
4 )
2
1 0 4
1 0 3
1 0 2
1 0
1
1 0 -1
1 0 -2
2 0
0
4 0 6 0 8 0 1 00 1 20 1 40 1 60 1 80 2 00
C o rg . [ µm ol/l]
[µmol/l]
C an org .
N O 3
-
P O 4
3O 2
program PHREEQC will then provide further
detailed information on the distribution of the
aquatic species and all the saturation indices
according to the Tables 15.2 and 15.3, which
presentation, however, was omitted in this context.
Decomposition of Organic Matter
by Oxygen and Nitrate
If certain boundary conditions are maintained,
the application of the model program PHREEQC
leads to options of particular interest, whenever
simulations of one, or several simultaneously
running reactions are carried out. The oxidation of
organic matter by dissolved oxygen - and after it
is consumed, by nitrate - represents a very
important reaction in seawater and especially in
the sediment. In the model calculation presented
in Figure 15.3 the following boundary conditions
were selected: The seawater under study, or
marine pore water, should be in a state of
equilibrium with the mineral calcite at the
beginning of the reaction and with a gaseous
phase containing 21 % O 2 and 0.034 % CO 2 . The
composition of this water sample is summarized in
Table 15.4. Organic substance containing amounts
of nitrogen and phosphorus according to the
Fig. 15.2 Predominance Field Diagram for arsenic under the condition of manganese nodule formation at the bottom
of the deep sea (after Glasby and Schulz 1999). The calculations in this diagram were performed with the model
PHREEQC. The partial diagram on the left only represents the predominant ranges of the aquatic species. The diagram
on the right covers the ranges of several minerals which are, under the given conditions, supersaturated (SI > 0).
Fig. 15.3 Geochemical model calculation using the program PHREEQC. To an oxic seawater with calcite in
equilibrium (cf. Table 15.4) an organic substance is
gradually added automatically leading to a redox reaction.
The system should continue to be open to calcite
equilibrium, but sealed from the gaseous phase
environment. First, free oxygen, and subsequently nitrate,
will be consumed. Afterwards, the system shifts to the anoxic state (cf. continuance of reactions in Fig. 15.4).
15.1
Geochemical Models
pH
0
2
4
6
8
10
12
14
1.0
0.8
0.6
0.4
0.2
0.0
-0.2
-0.4
-0.6
-0.8
Eh (V)
pH 2 > 1
pO 2 > 1
0
2
4
6
8
10
12
14
1.0
0.8
0.6
0.4
0.2
0.0
-0.2
-0.4
-0.6
-0.8
Eh (V)
pH 2 > 1
pO 2 > 1
pH
H 2 AsO 4
-
HAsO 4
2H 3 AsO 4
AsO 4
3H 3 AsO 3
H 2 AsO 3
-
HAsO 3
2AsO 3
3Ba
3 (AsO
4 )
2
1 0 4
1 0 3
1 0 2
1 0
1
1 0 -1
1 0 -2
2 0
0
4 0 6 0 8 0 1 00 1 20 1 40 1 60 1 80 2 00
C o rg . [ µm ol/l]
[µmol/l]
C an org .
N O 3
-
P O 4
3O 2