

15 Conceptual Models and Computer Models
520
fashion from the given specific conditions. On the
other hand, this information cannot any longer be
included reasonably into one diagram only. Here,
one diagram is used exclusively for the predominance field of aquatic species (left diagram),
whereas a second is used to visualize the saturation ranges of the various minerals (right
diagram). This makes sense inasmuch as,
wherever minerals become supersaturated, there
will nevertheless be an according distribution of
the aquatic species that cannot simply be omitted
in preference of the minerals. The diagrams
shown on the right-hand side reflect the saturation ranges. Here, it is reasonable to depict overlapping ranges of various minerals, because
which mineral might precipitate - and which one
will not - is not determined on account of these
statements or the degree of supersaturation.
Adjustment of Equilibria to Minerals and to the
Gaseous Phase
Calcite is supersaturated in seawater which is
described with regard to its solutes in the Tables
15.1 to 15.3. For calcite, the degree of supersaturation is expressed by the saturation index of
0.76, as shown in Table 15.3. Moreover, the partial
pressures values of the gaseous phases pCO 2 and
pO 2 (log pCO 2 = -3.38; log pO 2 = -0.70) are indicated which differ only slightly from the respective atmospheric values. Now it would make sense
to ask what composition of this seawater is to be
expected, if the equilibria were adjusted to the
atmospheric CO 2 and O 2 -partial pressure, and, for
example, to the mineral calcite that eventually
might need to be precipitated. Table 15.4 shows
the result of such a calculation with regard to the
essential properties of the solution. Naturally, the
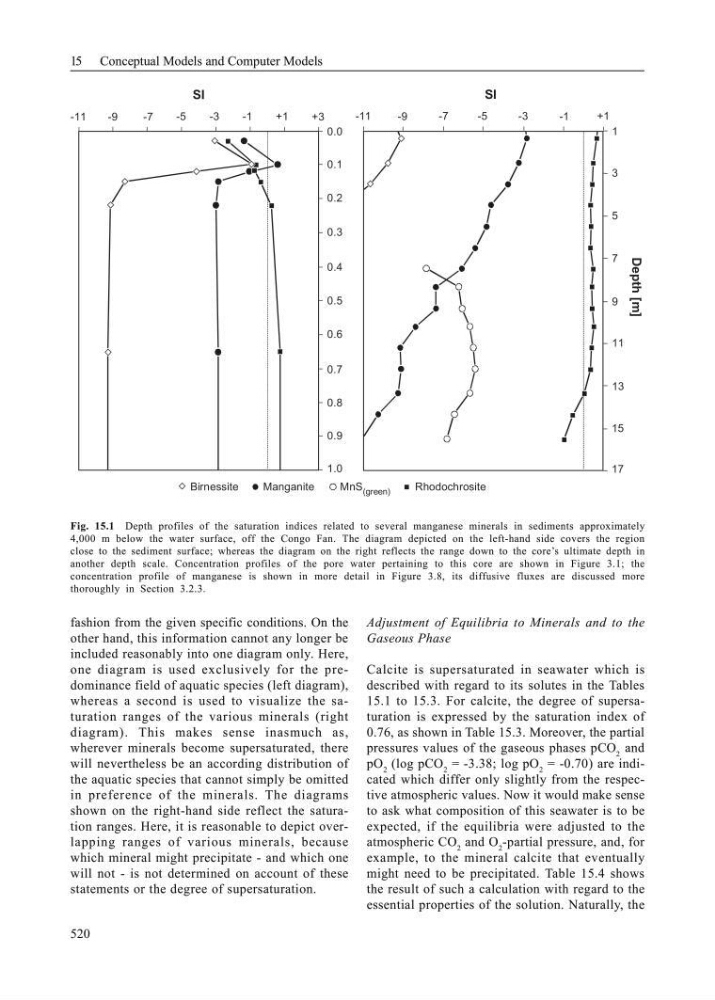
Fig. 15.1 Depth profiles of the saturation indices related to several manganese minerals in sediments approximately
4,000 m below the water surface, off the Congo Fan. The diagram depicted on the left-hand side covers the region
close to the sediment surface; whereas the diagram on the right reflects the range down to the core’s ultimate depth in
another depth scale. Concentration profiles of the pore water pertaining to this core are shown in Figure 3.1; the
concentration profile of manganese is shown in more detail in Figure 3.8, its diffusive fluxes are discussed more
thoroughly in Section 3.2.3.
-11
-9
-7
-5
-3
-1
+1
0.0
+3
0.1
0.2
0.3
0.4
0.5
0.6
0.7
0.8
0.9
1.0
1
3
5
7
9
11
13
15
17
-11
-9
-7
-5
-3
-1
+1
Depth [m]
SI
SI
Manganite
Birnessite
Rhodochrosite
MnS (green)
520
fashion from the given specific conditions. On the
other hand, this information cannot any longer be
included reasonably into one diagram only. Here,
one diagram is used exclusively for the predominance field of aquatic species (left diagram),
whereas a second is used to visualize the saturation ranges of the various minerals (right
diagram). This makes sense inasmuch as,
wherever minerals become supersaturated, there
will nevertheless be an according distribution of
the aquatic species that cannot simply be omitted
in preference of the minerals. The diagrams
shown on the right-hand side reflect the saturation ranges. Here, it is reasonable to depict overlapping ranges of various minerals, because
which mineral might precipitate - and which one
will not - is not determined on account of these
statements or the degree of supersaturation.
Adjustment of Equilibria to Minerals and to the
Gaseous Phase
Calcite is supersaturated in seawater which is
described with regard to its solutes in the Tables
15.1 to 15.3. For calcite, the degree of supersaturation is expressed by the saturation index of
0.76, as shown in Table 15.3. Moreover, the partial
pressures values of the gaseous phases pCO 2 and
pO 2 (log pCO 2 = -3.38; log pO 2 = -0.70) are indicated which differ only slightly from the respective atmospheric values. Now it would make sense
to ask what composition of this seawater is to be
expected, if the equilibria were adjusted to the
atmospheric CO 2 and O 2 -partial pressure, and, for
example, to the mineral calcite that eventually
might need to be precipitated. Table 15.4 shows
the result of such a calculation with regard to the
essential properties of the solution. Naturally, the
Fig. 15.1 Depth profiles of the saturation indices related to several manganese minerals in sediments approximately
4,000 m below the water surface, off the Congo Fan. The diagram depicted on the left-hand side covers the region
close to the sediment surface; whereas the diagram on the right reflects the range down to the core’s ultimate depth in
another depth scale. Concentration profiles of the pore water pertaining to this core are shown in Figure 3.1; the
concentration profile of manganese is shown in more detail in Figure 3.8, its diffusive fluxes are discussed more
thoroughly in Section 3.2.3.
-11
-9
-7
-5
-3
-1
+1
0.0
+3
0.1
0.2
0.3
0.4
0.5
0.6
0.7
0.8
0.9
1.0
1
3
5
7
9
11
13
15
17
-11
-9
-7
-5
-3
-1
+1
Depth [m]
SI
SI
Manganite
Birnessite
Rhodochrosite
MnS (green)