

519
manganite (MnOOH), birnessite (MnO 2 ), manganese
sulfide (MnS), and rhodochrosite (MnCO 3 ).
The precipitation of manganese oxides, and manganese hydroxides, is very obvious at a depth of
about 0.1 m below the sediment surface. For the minerals manganite and birnessite, exemplifying a
group of similar minerals, the saturation indices lie
around zero. In deeper core regions these and all
other oxides and hydroxides are in a state of undersaturation.
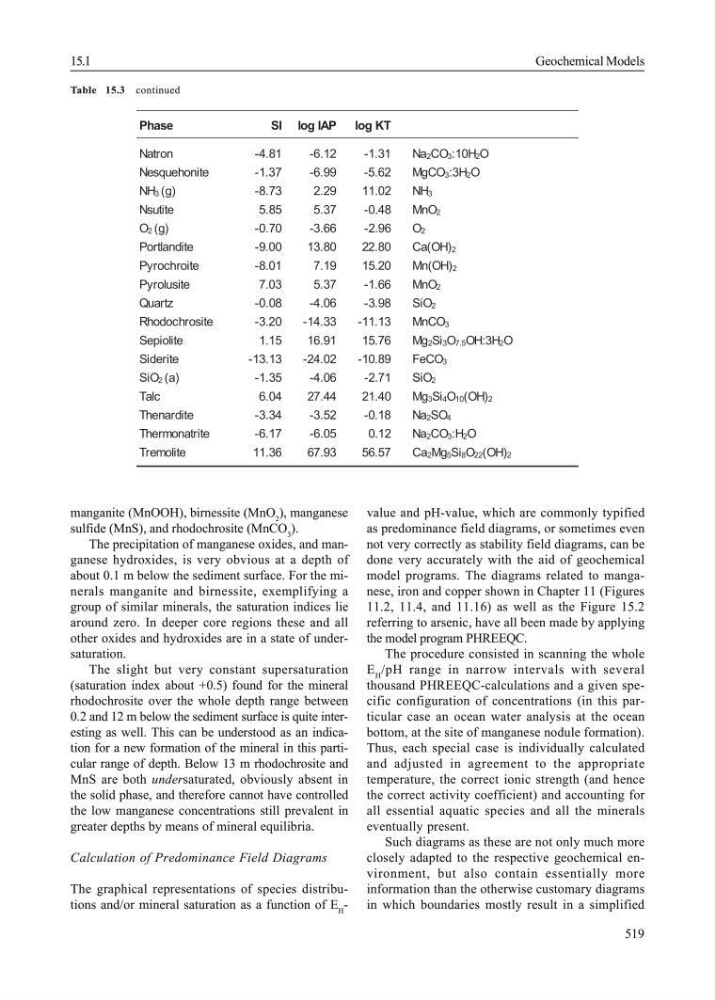
The slight but very constant supersaturation
(saturation index about +0.5) found for the mineral
rhodochrosite over the whole depth range between
0.2 and 12 m below the sediment surface is quite interesting as well. This can be understood as an indication for a new formation of the mineral in this particular range of depth. Below 13 m rhodochrosite and
MnS are both undersaturated, obviously absent in
the solid phase, and therefore cannot have controlled
the low manganese concentrations still prevalent in
greater depths by means of mineral equilibria.
Calculation of Predominance Field Diagrams
The graphical representations of species distributions and/or mineral saturation as a function of E H -
value and pH-value, which are commonly typified
as predominance field diagrams, or sometimes even
not very correctly as stability field diagrams, can be
done very accurately with the aid of geochemical
model programs. The diagrams related to manganese, iron and copper shown in Chapter 11 (Figures
11.2, 11.4, and 11.16) as well as the Figure 15.2
referring to arsenic, have all been made by applying
the model program PHREEQC.
The procedure consisted in scanning the whole
E H /pH range in narrow intervals with several
thousand PHREEQC-calculations and a given specific configuration of concentrations (in this particular case an ocean water analysis at the ocean
bottom, at the site of manganese nodule formation).
Thus, each special case is individually calculated
and adjusted in agreement to the appropriate
temperature, the correct ionic strength (and hence
the correct activity coefficient) and accounting for
all essential aquatic species and all the minerals
eventually present.
Such diagrams as these are not only much more
closely adapted to the respective geochemical environment, but also contain essentially more
information than the otherwise customary diagrams
in which boundaries mostly result in a simplified
Phase
SI log IAP
log KT
Natron
-4.81
-6.12
-1.31
Na2CO3:10H2O
Nesquehonite
-1.37
-6.99
-5.62
MgCO3:3H2O
NH3 (g)
-8.73
2.29
11.02
NH3
Nsutite
5.85
5.37
-0.48
MnO2
O2 (g)
-0.70
-3.66
-2.96
O2
Portlandite
-9.00
13.80
22.80
Ca(OH)2
Pyrochroite
-8.01
7.19
15.20
Mn(OH) 2
Pyrolusite
7.03
5.37
-1.66
MnO2
Quartz
-0.08
-4.06
-3.98
SiO2
Rhodochrosite
-3.20
-14.33
-11.13
MnCO3
Sepiolite
1.15
16.91
15.76
Mg2Si3O7.5OH:3H2O
Siderite
-13.13
-24.02
-10.89
FeCO3
SiO2 (a)
-1.35
-4.06
-2.71
SiO2
Talc
6.04
27.44
21.40
Mg3Si4O10(OH)2
Thenardite
-3.34
-3.52
-0.18
Na2SO4
Thermonatrite
-6.17
-6.05
0.12
Na2CO3:H2O
Tremolite
11.36
67.93
56.57
Ca2Mg5Si8O22(OH)2
15.1
Geochemical Models
Table 15.3 continued
manganite (MnOOH), birnessite (MnO 2 ), manganese
sulfide (MnS), and rhodochrosite (MnCO 3 ).
The precipitation of manganese oxides, and manganese hydroxides, is very obvious at a depth of
about 0.1 m below the sediment surface. For the minerals manganite and birnessite, exemplifying a
group of similar minerals, the saturation indices lie
around zero. In deeper core regions these and all
other oxides and hydroxides are in a state of undersaturation.
The slight but very constant supersaturation
(saturation index about +0.5) found for the mineral
rhodochrosite over the whole depth range between
0.2 and 12 m below the sediment surface is quite interesting as well. This can be understood as an indication for a new formation of the mineral in this particular range of depth. Below 13 m rhodochrosite and
MnS are both undersaturated, obviously absent in
the solid phase, and therefore cannot have controlled
the low manganese concentrations still prevalent in
greater depths by means of mineral equilibria.
Calculation of Predominance Field Diagrams
The graphical representations of species distributions and/or mineral saturation as a function of E H -
value and pH-value, which are commonly typified
as predominance field diagrams, or sometimes even
not very correctly as stability field diagrams, can be
done very accurately with the aid of geochemical
model programs. The diagrams related to manganese, iron and copper shown in Chapter 11 (Figures
11.2, 11.4, and 11.16) as well as the Figure 15.2
referring to arsenic, have all been made by applying
the model program PHREEQC.
The procedure consisted in scanning the whole
E H /pH range in narrow intervals with several
thousand PHREEQC-calculations and a given specific configuration of concentrations (in this particular case an ocean water analysis at the ocean
bottom, at the site of manganese nodule formation).
Thus, each special case is individually calculated
and adjusted in agreement to the appropriate
temperature, the correct ionic strength (and hence
the correct activity coefficient) and accounting for
all essential aquatic species and all the minerals
eventually present.
Such diagrams as these are not only much more
closely adapted to the respective geochemical environment, but also contain essentially more
information than the otherwise customary diagrams
in which boundaries mostly result in a simplified
Phase
SI log IAP
log KT
Natron
-4.81
-6.12
-1.31
Na2CO3:10H2O
Nesquehonite
-1.37
-6.99
-5.62
MgCO3:3H2O
NH3 (g)
-8.73
2.29
11.02
NH3
Nsutite
5.85
5.37
-0.48
MnO2
O2 (g)
-0.70
-3.66
-2.96
O2
Portlandite
-9.00
13.80
22.80
Ca(OH)2
Pyrochroite
-8.01
7.19
15.20
Mn(OH) 2
Pyrolusite
7.03
5.37
-1.66
MnO2
Quartz
-0.08
-4.06
-3.98
SiO2
Rhodochrosite
-3.20
-14.33
-11.13
MnCO3
Sepiolite
1.15
16.91
15.76
Mg2Si3O7.5OH:3H2O
Siderite
-13.13
-24.02
-10.89
FeCO3
SiO2 (a)
-1.35
-4.06
-2.71
SiO2
Talc
6.04
27.44
21.40
Mg3Si4O10(OH)2
Thenardite
-3.34
-3.52
-0.18
Na2SO4
Thermonatrite
-6.17
-6.05
0.12
Na2CO3:H2O
Tremolite
11.36
67.93
56.57
Ca2Mg5Si8O22(OH)2
15.1
Geochemical Models
Table 15.3 continued