

14 Gas Hydrates in Marine Sediments
500
Typical deep-sea drilling sampling resolution is
on the order of one sample every 3 to 10 meters.
Other proxies have been developed to produce a more continuous, high resolution record
of hydrate distribution in marine sediments.
Among these, the use of an infrared (IR) camera
to map cold spots in the core resulting from the
endothermic decomposition of gas hydrate has
proven to be highly effective (e.g. Weinberg et al.
2005). However the absolute value of the
temperature measured by the IR camera depends
on many different variables, including time of day,
core depth and coring technique (Tréhu et al.
2003), and plots of temperature along the core are
very noisy. A simple way of parametizing and
displaying the IR temperature data is to define ∆T
as the temperature anomaly relative to the local
background. High-resolution measurements of
chloride anomalies in core sections previously
imaged with an IR camera can provide a
calibration function needed to correlate the
temperature anomaly with hydrate content, as
shown in Figure 14.16B. These data, not only
provide a means of calibrating the temperature
anomalies, but also illustrates how a discrete
hydrate layer can be easily missed with coarse
sampling resolution. Samples collected from a 2cm-thick hydrate layer and as much as 5 cm away
from it show significant anomalies in the chloride
content, whereas samples collected at distances
>10 cm from the hydrate layer do not show any
deviation from the background chloride values
(Fig. 14.15).
Whereas the dissolved chloride measurements
alone may not fully constrain the gas hydrate
distribution, the good correlation between
dissolved chloride and temperature anomalies
shown in Figure 14.16 (Tréhu et al. 2004a), gives
support to the use of a combined ∆T-∆Cl approach
to best define an heterogeneous hydrate distribution. An understanding of the spatial variability in gas hydrate distribution may provide
valuable insights into the possible response of
these deposits to tectonic and environmental
change.
Gas Hydrate Destabilization via Natural Processes
If environmental changes induce gas hydrate
dissociation, the negative anomaly associated
with water release would be attenuated over time
by diffusion processes. The mathematical treatment of the signal attenuation is analogous to
that described above for hydrate formation. An
example of the chloride attenuation from natural
dissociation processes on Hydrate Ridge is
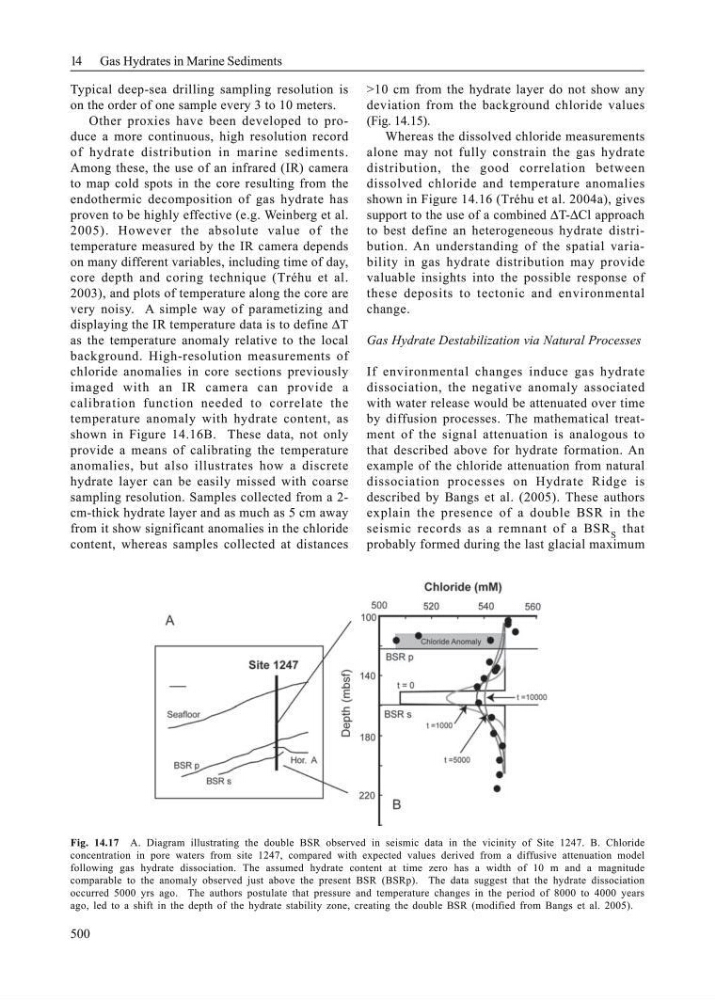
described by Bangs et al. (2005). These authors
explain the presence of a double BSR in the
seismic records as a remnant of a BSR S that
probably formed during the last glacial maximum
Fig. 14.17 A. Diagram illustrating the double BSR observed in seismic data in the vicinity of Site 1247. B. Chloride
concentration in pore waters from site 1247, compared with expected values derived from a diffusive attenuation model
following gas hydrate dissociation. The assumed hydrate content at time zero has a width of 10 m and a magnitude
comparable to the anomaly observed just above the present BSR (BSRp). The data suggest that the hydrate dissociation
occurred 5000 yrs ago. The authors postulate that pressure and temperature changes in the period of 8000 to 4000 years
ago, led to a shift in the depth of the hydrate stability zone, creating the double BSR (modified from Bangs et al. 2005).
500
Typical deep-sea drilling sampling resolution is
on the order of one sample every 3 to 10 meters.
Other proxies have been developed to produce a more continuous, high resolution record
of hydrate distribution in marine sediments.
Among these, the use of an infrared (IR) camera
to map cold spots in the core resulting from the
endothermic decomposition of gas hydrate has
proven to be highly effective (e.g. Weinberg et al.
2005). However the absolute value of the
temperature measured by the IR camera depends
on many different variables, including time of day,
core depth and coring technique (Tréhu et al.
2003), and plots of temperature along the core are
very noisy. A simple way of parametizing and
displaying the IR temperature data is to define ∆T
as the temperature anomaly relative to the local
background. High-resolution measurements of
chloride anomalies in core sections previously
imaged with an IR camera can provide a
calibration function needed to correlate the
temperature anomaly with hydrate content, as
shown in Figure 14.16B. These data, not only
provide a means of calibrating the temperature
anomalies, but also illustrates how a discrete
hydrate layer can be easily missed with coarse
sampling resolution. Samples collected from a 2cm-thick hydrate layer and as much as 5 cm away
from it show significant anomalies in the chloride
content, whereas samples collected at distances
>10 cm from the hydrate layer do not show any
deviation from the background chloride values
(Fig. 14.15).
Whereas the dissolved chloride measurements
alone may not fully constrain the gas hydrate
distribution, the good correlation between
dissolved chloride and temperature anomalies
shown in Figure 14.16 (Tréhu et al. 2004a), gives
support to the use of a combined ∆T-∆Cl approach
to best define an heterogeneous hydrate distribution. An understanding of the spatial variability in gas hydrate distribution may provide
valuable insights into the possible response of
these deposits to tectonic and environmental
change.
Gas Hydrate Destabilization via Natural Processes
If environmental changes induce gas hydrate
dissociation, the negative anomaly associated
with water release would be attenuated over time
by diffusion processes. The mathematical treatment of the signal attenuation is analogous to
that described above for hydrate formation. An
example of the chloride attenuation from natural
dissociation processes on Hydrate Ridge is
described by Bangs et al. (2005). These authors
explain the presence of a double BSR in the
seismic records as a remnant of a BSR S that
probably formed during the last glacial maximum
Fig. 14.17 A. Diagram illustrating the double BSR observed in seismic data in the vicinity of Site 1247. B. Chloride
concentration in pore waters from site 1247, compared with expected values derived from a diffusive attenuation model
following gas hydrate dissociation. The assumed hydrate content at time zero has a width of 10 m and a magnitude
comparable to the anomaly observed just above the present BSR (BSRp). The data suggest that the hydrate dissociation
occurred 5000 yrs ago. The authors postulate that pressure and temperature changes in the period of 8000 to 4000 years
ago, led to a shift in the depth of the hydrate stability zone, creating the double BSR (modified from Bangs et al. 2005).