

499
temperature and age of accreted sediments (Fig. 14.15).
Whereas discrete negative anomalies within the GHSZ
are indeed the result of gas hydrate dissociation during
core recovery, the smooth decrease with depth is
independent of gas hydrate processes, and instead
reflects the degree of illitization at depth. These results
indicate that the smooth decrease with depth, commonly observed at sites drilled over accreted mélanges, is not directly related to gas hydrate abundance.
Instead, chloride anomalies associated with gas
hydrate should be calculated from discrete excursions
to negative values against a background defined by
the envelope of the measurements. In order to
confidently define the dissolved chloride background
concentration, care should be taken in obtaining
enough resolution of the pore fluid sampling.
The presence of negative “spikes” in the
chloride distribution suggests that the distribution of gas hydrate in marine sediments is highly
heterogeneous. Whereas some observations reveal association of hydrate with coarse, high
porosity horizons (Clennell et al. 1999), the
factors controlling distribution of gas hydrate are
not fully understood. Nevertheless, the question
remains as to whether the patchy distribution of
these deposits can be adequately mapped with
pore water analyses. Limitations on how much
pore water can be extracted from a section of the
core, how many core sections can be dedicated to
these analyses, and the time needed for each
measurement, usually only allow for sparse
measurements of the pore water composition.
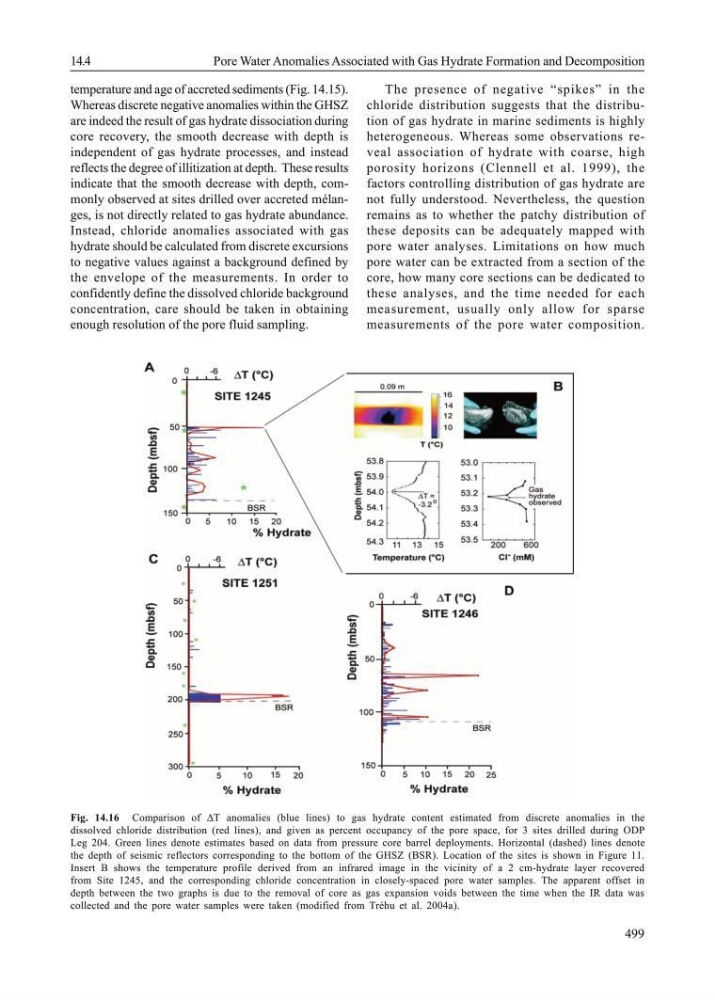
Fig. 14.16 Comparison of ∆T anomalies (blue lines) to gas hydrate content estimated from discrete anomalies in the
dissolved chloride distribution (red lines), and given as percent occupancy of the pore space, for 3 sites drilled during ODP
Leg 204. Green lines denote estimates based on data from pressure core barrel deployments. Horizontal (dashed) lines denote
the depth of seismic reflectors corresponding to the bottom of the GHSZ (BSR). Location of the sites is shown in Figure 11.
Insert B shows the temperature profile derived from an infrared image in the vicinity of a 2 cm-hydrate layer recovered
from Site 1245, and the corresponding chloride concentration in closely-spaced pore water samples. The apparent offset in
depth between the two graphs is due to the removal of core as gas expansion voids between the time when the IR data was
collected and the pore water samples were taken (modified from Tréhu et al. 2004a).
14.4
Pore Water Anomalies Associated with Gas Hydrate Formation and Decomposition
temperature and age of accreted sediments (Fig. 14.15).
Whereas discrete negative anomalies within the GHSZ
are indeed the result of gas hydrate dissociation during
core recovery, the smooth decrease with depth is
independent of gas hydrate processes, and instead
reflects the degree of illitization at depth. These results
indicate that the smooth decrease with depth, commonly observed at sites drilled over accreted mélanges, is not directly related to gas hydrate abundance.
Instead, chloride anomalies associated with gas
hydrate should be calculated from discrete excursions
to negative values against a background defined by
the envelope of the measurements. In order to
confidently define the dissolved chloride background
concentration, care should be taken in obtaining
enough resolution of the pore fluid sampling.
The presence of negative “spikes” in the
chloride distribution suggests that the distribution of gas hydrate in marine sediments is highly
heterogeneous. Whereas some observations reveal association of hydrate with coarse, high
porosity horizons (Clennell et al. 1999), the
factors controlling distribution of gas hydrate are
not fully understood. Nevertheless, the question
remains as to whether the patchy distribution of
these deposits can be adequately mapped with
pore water analyses. Limitations on how much
pore water can be extracted from a section of the
core, how many core sections can be dedicated to
these analyses, and the time needed for each
measurement, usually only allow for sparse
measurements of the pore water composition.
Fig. 14.16 Comparison of ∆T anomalies (blue lines) to gas hydrate content estimated from discrete anomalies in the
dissolved chloride distribution (red lines), and given as percent occupancy of the pore space, for 3 sites drilled during ODP
Leg 204. Green lines denote estimates based on data from pressure core barrel deployments. Horizontal (dashed) lines denote
the depth of seismic reflectors corresponding to the bottom of the GHSZ (BSR). Location of the sites is shown in Figure 11.
Insert B shows the temperature profile derived from an infrared image in the vicinity of a 2 cm-hydrate layer recovered
from Site 1245, and the corresponding chloride concentration in closely-spaced pore water samples. The apparent offset in
depth between the two graphs is due to the removal of core as gas expansion voids between the time when the IR data was
collected and the pore water samples were taken (modified from Tréhu et al. 2004a).
14.4
Pore Water Anomalies Associated with Gas Hydrate Formation and Decomposition