

485
14.3 Hydrate Occurrence in the
Oceanic Environment
14.3.1 Gas Hydrate Stability Zone in
Marine Sediments
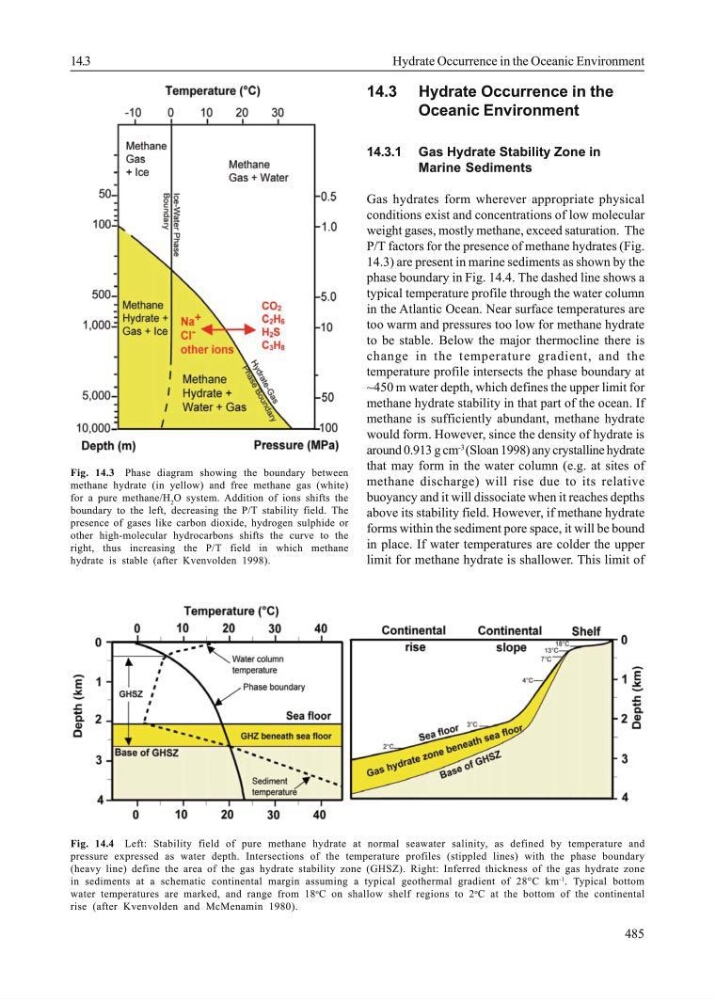
Gas hydrates form wherever appropriate physical
conditions exist and concentrations of low molecular
weight gases, mostly methane, exceed saturation. The
P/T factors for the presence of methane hydrates (Fig.
14.3) are present in marine sediments as shown by the
phase boundary in Fig. 14.4. The dashed line shows a
typical temperature profile through the water column
in the Atlantic Ocean. Near surface temperatures are
too warm and pressures too low for methane hydrate
to be stable. Below the major thermocline there is
change in the temperature gradient, and the
temperature profile intersects the phase boundary at
~450 m water depth, which defines the upper limit for
methane hydrate stability in that part of the ocean. If
methane is sufficiently abundant, methane hydrate
would form. However, since the density of hydrate is
around 0.913 g cm
-3
(Sloan 1998) any crystalline hydrate
that may form in the water column (e.g. at sites of
methane discharge) will rise due to its relative
buoyancy and it will dissociate when it reaches depths
above its stability field. However, if methane hydrate
forms within the sediment pore space, it will be bound
in place. If water temperatures are colder the upper
limit for methane hydrate is shallower. This limit of
Fig. 14.3 Phase diagram showing the boundary between
methane hydrate (in yellow) and free methane gas (white)
for a pure methane/H 2 O system. Addition of ions shifts the
boundary to the left, decreasing the P/T stability field. The
presence of gases like carbon dioxide, hydrogen sulphide or
other high-molecular hydrocarbons shifts the curve to the
right, thus increasing the P/T field in which methane
hydrate is stable (after Kvenvolden 1998).
Fig. 14.4 Left: Stability field of pure methane hydrate at normal seawater salinity, as defined by temperature and
pressure expressed as water depth. Intersections of the temperature profiles (stippled lines) with the phase boundary
(heavy line) define the area of the gas hydrate stability zone (GHSZ). Right: Inferred thickness of the gas hydrate zone
in sediments at a schematic continental margin assuming a typical geothermal gradient of 28°C km
-1 . Typical bottom
water temperatures are marked, and range from 18
o C on shallow shelf regions to 2
o C at the bottom of the continental
rise (after Kvenvolden and McMenamin 1980).
14.3
Hydrate Occurrence in the Oceanic Environment
14.3 Hydrate Occurrence in the
Oceanic Environment
14.3.1 Gas Hydrate Stability Zone in
Marine Sediments
Gas hydrates form wherever appropriate physical
conditions exist and concentrations of low molecular
weight gases, mostly methane, exceed saturation. The
P/T factors for the presence of methane hydrates (Fig.
14.3) are present in marine sediments as shown by the
phase boundary in Fig. 14.4. The dashed line shows a
typical temperature profile through the water column
in the Atlantic Ocean. Near surface temperatures are
too warm and pressures too low for methane hydrate
to be stable. Below the major thermocline there is
change in the temperature gradient, and the
temperature profile intersects the phase boundary at
~450 m water depth, which defines the upper limit for
methane hydrate stability in that part of the ocean. If
methane is sufficiently abundant, methane hydrate
would form. However, since the density of hydrate is
around 0.913 g cm
-3
(Sloan 1998) any crystalline hydrate
that may form in the water column (e.g. at sites of
methane discharge) will rise due to its relative
buoyancy and it will dissociate when it reaches depths
above its stability field. However, if methane hydrate
forms within the sediment pore space, it will be bound
in place. If water temperatures are colder the upper
limit for methane hydrate is shallower. This limit of
Fig. 14.3 Phase diagram showing the boundary between
methane hydrate (in yellow) and free methane gas (white)
for a pure methane/H 2 O system. Addition of ions shifts the
boundary to the left, decreasing the P/T stability field. The
presence of gases like carbon dioxide, hydrogen sulphide or
other high-molecular hydrocarbons shifts the curve to the
right, thus increasing the P/T field in which methane
hydrate is stable (after Kvenvolden 1998).
Fig. 14.4 Left: Stability field of pure methane hydrate at normal seawater salinity, as defined by temperature and
pressure expressed as water depth. Intersections of the temperature profiles (stippled lines) with the phase boundary
(heavy line) define the area of the gas hydrate stability zone (GHSZ). Right: Inferred thickness of the gas hydrate zone
in sediments at a schematic continental margin assuming a typical geothermal gradient of 28°C km
-1 . Typical bottom
water temperatures are marked, and range from 18
o C on shallow shelf regions to 2
o C at the bottom of the continental
rise (after Kvenvolden and McMenamin 1980).
14.3
Hydrate Occurrence in the Oceanic Environment