

437
12.3
The Interpretation of Patterns of Regionally Distributed Data
shows the global distribution of the mean annual
primary production of phytoplankton as simulated by Antoine et al. (1996). Based on the knowledge on how oceanic circulation and other physical parameters like radiation and wind mixing
affect the production of phytoplankton, four
major zones can be distinguished: 1) the polar
zones 2) the west wind zone 3) the trade wind
zone, and 4) the coastal zone (Sathyendranat et al.
1995). According to Longhurst et al. (1995) this
rough division can be subdivided into 57 biogeochemical provinces that display different dynamics regarding the processes of primary production. The deposition flux of organic carbon
may then be derived from application of simple
relationships (cf. Fig. 6.3), which can on average
provide useful results. But, as described below,
such calculations may be critical especially along
continental margins.
The second way to estimate the availability of
organic substance in the benthic realm is to
directly determine the organic carbon concentration in surface sediments (TOC) or to calculate
the organic carbon burial rate. The simplistic
approach to describe the dependence between the
C org -content and benthic flux rates has proven
successful in specific regions (cf. Figs. 6.23b and
6.25b). However, thousands of TOC measurements
exist worldwide, but problems related to the internal comparability of the data may arise here due to
sampling artifacts or the different analytical
methods applied. After all, organic substances are
not identically prone to the same degree of
microbial decomposition (cf. Chapter 5). Since the
analytical effort is enormous to classify the
organic carbon either according to its origin
(terrigenous or marine, e.g. by means of δ
13
C –
measurements, see Chapter 10), or its labile and
refractory proportions (e.g. Dauwe and Middelburg 1998; Dauwe et al. 1999; Schubert et al. 2005),
most C org amounts are reported as unspecified
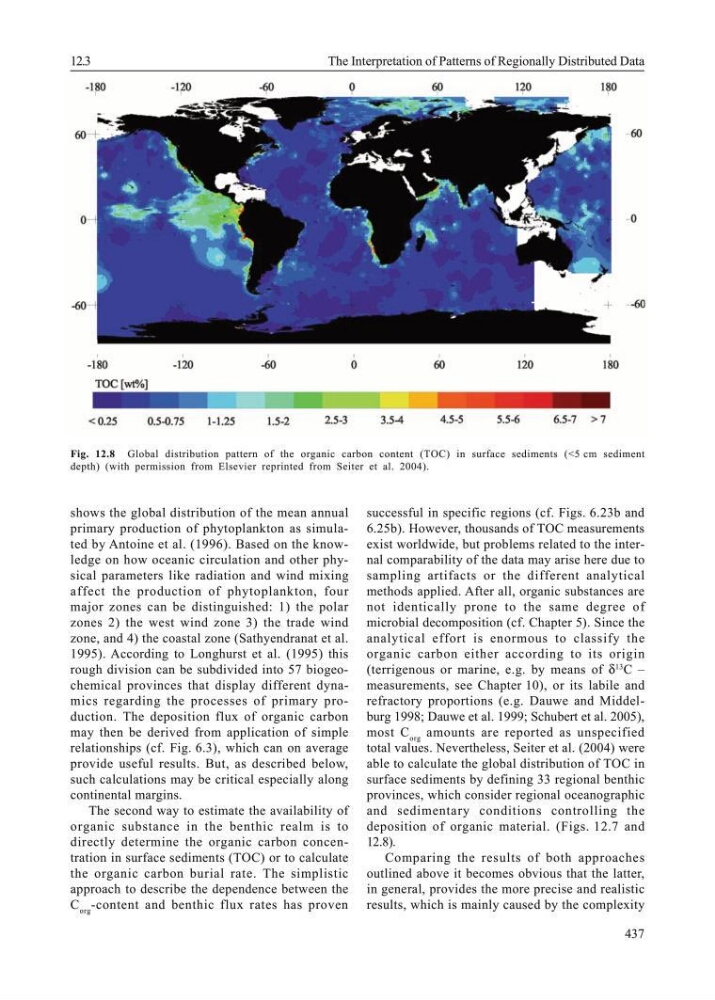
total values. Nevertheless, Seiter et al. (2004) were
able to calculate the global distribution of TOC in
surface sediments by defining 33 regional benthic
provinces, which consider regional oceanographic
and sedimentary conditions controlling the
deposition of organic material. (Figs. 12.7 and
12.8).
Comparing the results of both approaches
outlined above it becomes obvious that the latter,
in general, provides the more precise and realistic
results, which is mainly caused by the complexity
Fig. 12.8 Global distribution pattern of the organic carbon content (TOC) in surface sediments (<5 cm sediment
depth) (with permission from Elsevier reprinted from Seiter et al. 2004).
12.3
The Interpretation of Patterns of Regionally Distributed Data
shows the global distribution of the mean annual
primary production of phytoplankton as simulated by Antoine et al. (1996). Based on the knowledge on how oceanic circulation and other physical parameters like radiation and wind mixing
affect the production of phytoplankton, four
major zones can be distinguished: 1) the polar
zones 2) the west wind zone 3) the trade wind
zone, and 4) the coastal zone (Sathyendranat et al.
1995). According to Longhurst et al. (1995) this
rough division can be subdivided into 57 biogeochemical provinces that display different dynamics regarding the processes of primary production. The deposition flux of organic carbon
may then be derived from application of simple
relationships (cf. Fig. 6.3), which can on average
provide useful results. But, as described below,
such calculations may be critical especially along
continental margins.
The second way to estimate the availability of
organic substance in the benthic realm is to
directly determine the organic carbon concentration in surface sediments (TOC) or to calculate
the organic carbon burial rate. The simplistic
approach to describe the dependence between the
C org -content and benthic flux rates has proven
successful in specific regions (cf. Figs. 6.23b and
6.25b). However, thousands of TOC measurements
exist worldwide, but problems related to the internal comparability of the data may arise here due to
sampling artifacts or the different analytical
methods applied. After all, organic substances are
not identically prone to the same degree of
microbial decomposition (cf. Chapter 5). Since the
analytical effort is enormous to classify the
organic carbon either according to its origin
(terrigenous or marine, e.g. by means of δ
13
C –
measurements, see Chapter 10), or its labile and
refractory proportions (e.g. Dauwe and Middelburg 1998; Dauwe et al. 1999; Schubert et al. 2005),
most C org amounts are reported as unspecified
total values. Nevertheless, Seiter et al. (2004) were
able to calculate the global distribution of TOC in
surface sediments by defining 33 regional benthic
provinces, which consider regional oceanographic
and sedimentary conditions controlling the
deposition of organic material. (Figs. 12.7 and
12.8).
Comparing the results of both approaches
outlined above it becomes obvious that the latter,
in general, provides the more precise and realistic
results, which is mainly caused by the complexity
Fig. 12.8 Global distribution pattern of the organic carbon content (TOC) in surface sediments (<5 cm sediment
depth) (with permission from Elsevier reprinted from Seiter et al. 2004).