

12 Quantification and Regionalization of Benthic Reflux
436
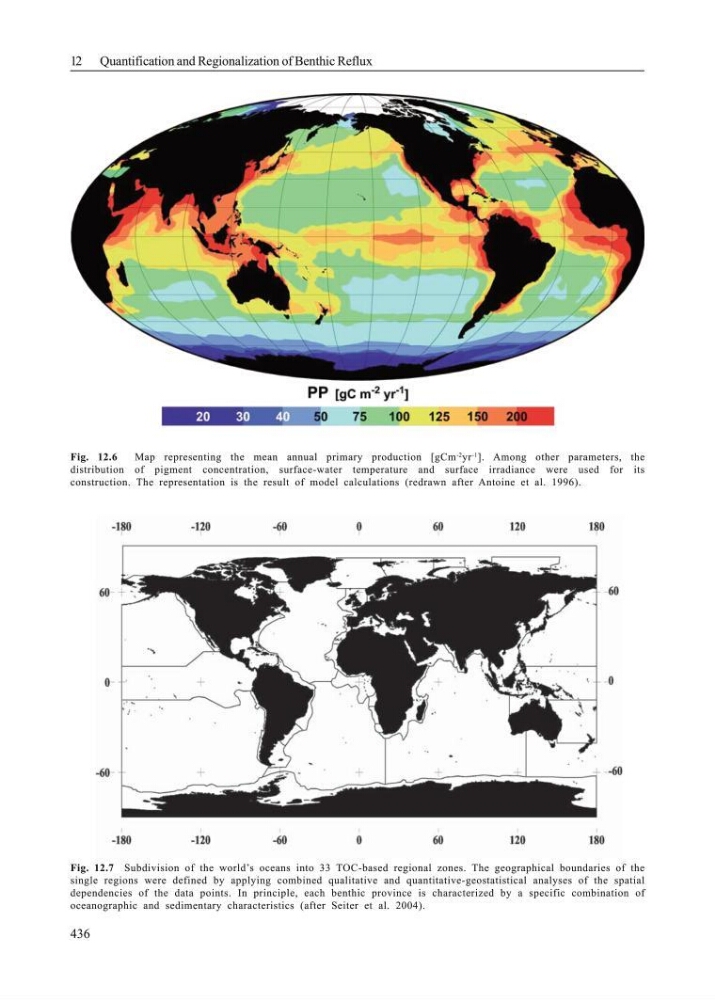
Fig. 12.6
Map representing the mean annual primary production [gCm
-2 yr
-1 ]. Among other parameters, the
distribution of pigment concentration, surface-water temperature and surface irradiance were used for its
construction. The representation is the result of model calculations (redrawn after Antoine et al. 1996).
Fig. 12.7 Subdivision of the world’s oceans into 33 TOC-based regional zones. The geographical boundaries of the
single regions were defined by applying combined qualitative and quantitative-geostatistical analyses of the spatial
dependencies of the data points. In principle, each benthic province is characterized by a specific combination of
oceanographic and sedimentary characteristics (after Seiter et al. 2004).
436
Fig. 12.6
Map representing the mean annual primary production [gCm
-2 yr
-1 ]. Among other parameters, the
distribution of pigment concentration, surface-water temperature and surface irradiance were used for its
construction. The representation is the result of model calculations (redrawn after Antoine et al. 1996).
Fig. 12.7 Subdivision of the world’s oceans into 33 TOC-based regional zones. The geographical boundaries of the
single regions were defined by applying combined qualitative and quantitative-geostatistical analyses of the spatial
dependencies of the data points. In principle, each benthic province is characterized by a specific combination of
oceanographic and sedimentary characteristics (after Seiter et al. 2004).