

12 Quantification and Regionalization of Benthic Reflux
432
Since biogeochemical reactions within the DBL are
negligible relative to the surface sediments,
measurements of concentration gradients across
this zone provide an accurate estimate of diffusive
benthic exchange. As has already been explained
in the Chapters 3 and 6, the necessary application
of microsensor technology in deep-sea environments is only feasible for analyzing very few
parameters (O 2 , CO 2 , Ca, H 2 S and pH). All other
profiling measurements are consequently based
on the conventional methods of pore water
extraction, or are conducted by applying ion
exchange resins in so-called gel peepers. The
sampling methods mentioned differ in their
underlying principles of measurement and in their
power of depth resolution, which is of enormous
significance concerning the rates of diffusive
exchange. As the concentration changes in the
pore water fraction situated immediately below the
DBL are linear only in exceptional cases, the
distance between each single reported concentration value markedly influences the determination of the exchange rate (cf. Chapter 3). An
increased sampling density can therefore easily
lead to changes of a factor of 2. Usually this
implies more pronounced gradients, as for example
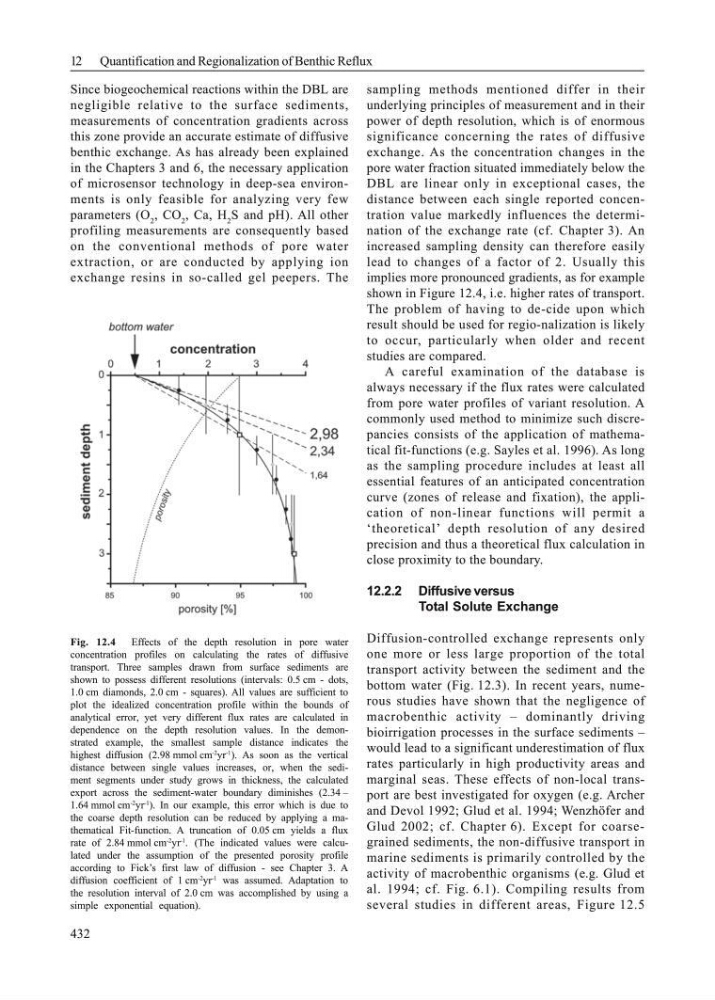
shown in Figure 12.4, i.e. higher rates of transport.
The problem of having to de-cide upon which
result should be used for regio-nalization is likely
to occur, particularly when older and recent
studies are compared.
A careful examination of the database is
always necessary if the flux rates were calculated
from pore water profiles of variant resolution. A
commonly used method to minimize such discrepancies consists of the application of mathematical fit-functions (e.g. Sayles et al. 1996). As long
as the sampling procedure includes at least all
essential features of an anticipated concentration
curve (zones of release and fixation), the application of non-linear functions will permit a
‘theoretical’ depth resolution of any desired
precision and thus a theoretical flux calculation in
close proximity to the boundary.
12.2.2 Diffusive versus
Total Solute Exchange
Diffusion-controlled exchange represents only
one more or less large proportion of the total
transport activity between the sediment and the
bottom water (Fig. 12.3). In recent years, numerous studies have shown that the negligence of
macrobenthic activity – dominantly driving
bioirrigation processes in the surface sediments –
would lead to a significant underestimation of flux
rates particularly in high productivity areas and
marginal seas. These effects of non-local transport are best investigated for oxygen (e.g. Archer
and Devol 1992; Glud et al. 1994; Wenzhöfer and
Glud 2002; cf. Chapter 6). Except for coarsegrained sediments, the non-diffusive transport in
marine sediments is primarily controlled by the
activity of macrobenthic organisms (e.g. Glud et
al. 1994; cf. Fig. 6.1). Compiling results from
several studies in different areas, Figure 12.5
Fig. 12.4
Effects of the depth resolution in pore water
concentration profiles on calculating the rates of diffusive
transport. Three samples drawn from surface sediments are
shown to possess different resolutions (intervals: 0.5 cm - dots,
1.0 cm diamonds, 2.0 cm - squares). All values are sufficient to
plot the idealized concentration profile within the bounds of
analytical error, yet very different flux rates are calculated in
dependence on the depth resolution values. In the demonstrated example, the smallest sample distance indicates the
highest diffusion (2.98 mmol cm
-2 yr
-1 ). As soon as the vertical
distance between single values increases, or, when the sediment segments under study grows in thickness, the calculated
export across the sediment-water boundary diminishes (2.34 –
1.64 mmol cm
-2 yr
-1 ). In our example, this error which is due to
the coarse depth resolution can be reduced by applying a mathematical Fit-function. A truncation of 0.05 cm yields a flux
rate of 2.84 mmol cm
-2 yr
-1 . (The indicated values were calculated under the assumption of the presented porosity profile
according to Fick’s first law of diffusion - see Chapter 3. A
diffusion coefficient of 1 cm
-2 yr
-1 was assumed. Adaptation to
the resolution interval of 2.0 cm was accomplished by using a
simple exponential equation).
432
Since biogeochemical reactions within the DBL are
negligible relative to the surface sediments,
measurements of concentration gradients across
this zone provide an accurate estimate of diffusive
benthic exchange. As has already been explained
in the Chapters 3 and 6, the necessary application
of microsensor technology in deep-sea environments is only feasible for analyzing very few
parameters (O 2 , CO 2 , Ca, H 2 S and pH). All other
profiling measurements are consequently based
on the conventional methods of pore water
extraction, or are conducted by applying ion
exchange resins in so-called gel peepers. The
sampling methods mentioned differ in their
underlying principles of measurement and in their
power of depth resolution, which is of enormous
significance concerning the rates of diffusive
exchange. As the concentration changes in the
pore water fraction situated immediately below the
DBL are linear only in exceptional cases, the
distance between each single reported concentration value markedly influences the determination of the exchange rate (cf. Chapter 3). An
increased sampling density can therefore easily
lead to changes of a factor of 2. Usually this
implies more pronounced gradients, as for example
shown in Figure 12.4, i.e. higher rates of transport.
The problem of having to de-cide upon which
result should be used for regio-nalization is likely
to occur, particularly when older and recent
studies are compared.
A careful examination of the database is
always necessary if the flux rates were calculated
from pore water profiles of variant resolution. A
commonly used method to minimize such discrepancies consists of the application of mathematical fit-functions (e.g. Sayles et al. 1996). As long
as the sampling procedure includes at least all
essential features of an anticipated concentration
curve (zones of release and fixation), the application of non-linear functions will permit a
‘theoretical’ depth resolution of any desired
precision and thus a theoretical flux calculation in
close proximity to the boundary.
12.2.2 Diffusive versus
Total Solute Exchange
Diffusion-controlled exchange represents only
one more or less large proportion of the total
transport activity between the sediment and the
bottom water (Fig. 12.3). In recent years, numerous studies have shown that the negligence of
macrobenthic activity – dominantly driving
bioirrigation processes in the surface sediments –
would lead to a significant underestimation of flux
rates particularly in high productivity areas and
marginal seas. These effects of non-local transport are best investigated for oxygen (e.g. Archer
and Devol 1992; Glud et al. 1994; Wenzhöfer and
Glud 2002; cf. Chapter 6). Except for coarsegrained sediments, the non-diffusive transport in
marine sediments is primarily controlled by the
activity of macrobenthic organisms (e.g. Glud et
al. 1994; cf. Fig. 6.1). Compiling results from
several studies in different areas, Figure 12.5
Fig. 12.4
Effects of the depth resolution in pore water
concentration profiles on calculating the rates of diffusive
transport. Three samples drawn from surface sediments are
shown to possess different resolutions (intervals: 0.5 cm - dots,
1.0 cm diamonds, 2.0 cm - squares). All values are sufficient to
plot the idealized concentration profile within the bounds of
analytical error, yet very different flux rates are calculated in
dependence on the depth resolution values. In the demonstrated example, the smallest sample distance indicates the
highest diffusion (2.98 mmol cm
-2 yr
-1 ). As soon as the vertical
distance between single values increases, or, when the sediment segments under study grows in thickness, the calculated
export across the sediment-water boundary diminishes (2.34 –
1.64 mmol cm
-2 yr
-1 ). In our example, this error which is due to
the coarse depth resolution can be reduced by applying a mathematical Fit-function. A truncation of 0.05 cm yields a flux
rate of 2.84 mmol cm
-2 yr
-1 . (The indicated values were calculated under the assumption of the presented porosity profile
according to Fick’s first law of diffusion - see Chapter 3. A
diffusion coefficient of 1 cm
-2 yr
-1 was assumed. Adaptation to
the resolution interval of 2.0 cm was accomplished by using a
simple exponential equation).