

417
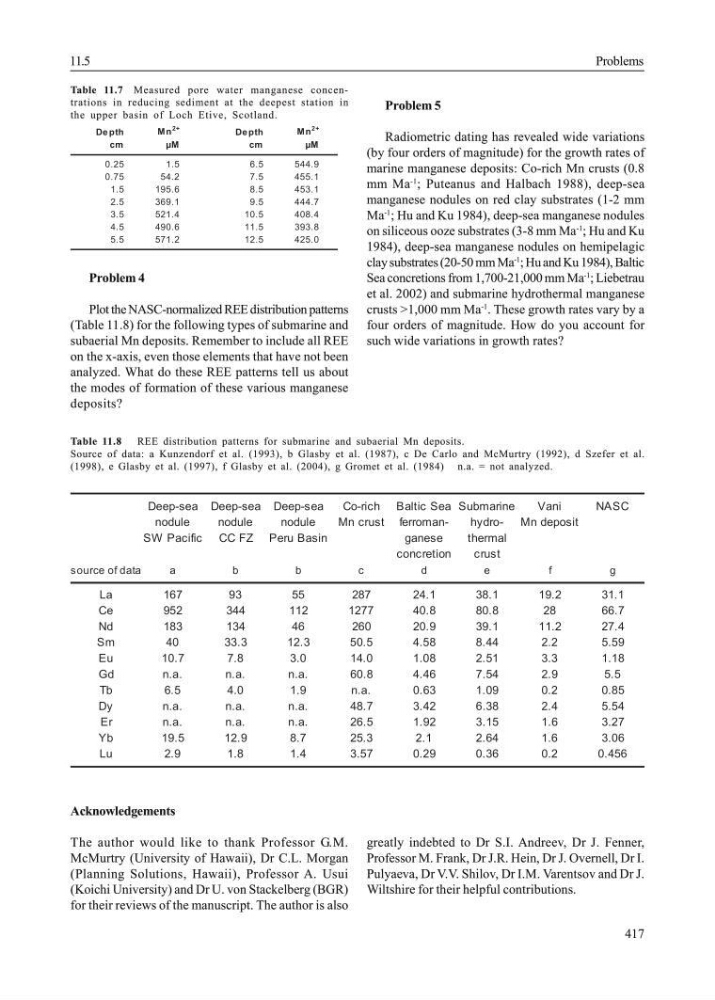
Table 11.7 Measured pore water manganese concentrations in reducing sediment at the deepest station in
the upper basin of Loch Etive, Scotland.
Problem 4
Plot the NASC-normalized REE distribution patterns
(Table 11.8) for the following types of submarine and
subaerial Mn deposits. Remember to include all REE
on the x-axis, even those elements that have not been
analyzed. What do these REE patterns tell us about
the modes of formation of these various manganese
deposits?
Problem 5
Radiometric dating has revealed wide variations
(by four orders of magnitude) for the growth rates of
marine manganese deposits: Co-rich Mn crusts (0.8
mm Ma
-1
; Puteanus and Halbach 1988), deep-sea
manganese nodules on red clay substrates (1-2 mm
Ma
-1
; Hu and Ku 1984), deep-sea manganese nodules
on siliceous ooze substrates (3-8 mm Ma
-1
; Hu and Ku
1984), deep-sea manganese nodules on hemipelagic
clay substrates (20-50 mm Ma
-1
; Hu and Ku 1984), Baltic
Sea concretions from 1,700-21,000 mm Ma
-1
; Liebetrau
et al. 2002) and submarine hydrothermal manganese
crusts >1,000 mm Ma
-1
. These growth rates vary by a
four orders of magnitude. How do you account for
such wide variations in growth rates?
Table 11.8
REE distribution patterns for submarine and subaerial Mn deposits.
Source of data: a Kunzendorf et al. (1993), b Glasby et al. (1987), c De Carlo and McMurtry (1992), d Szefer et al.
(1998), e Glasby et al. (1997), f Glasby et al. (2004), g Gromet et al. (1984) n.a. = not analyzed.
Acknowledgements
The author would like to thank Professor G.M.
McMurtry (University of Hawaii), Dr C.L. Morgan
(Planning Solutions, Hawaii), Professor A. Usui
(Koichi University) and Dr U. von Stackelberg (BGR)
for their reviews of the manuscript. The author is also
greatly indebted to Dr S.I. Andreev, Dr J. Fenner,
Professor M. Frank, Dr J.R. Hein, Dr J. Overnell, Dr I.
Pulyaeva, Dr V.V. Shilov, Dr I.M. Varentsov and Dr J.
Wiltshire for their helpful contributions.
De pth
Mn
2+
De pth
Mn
2+
cm
µM
cm
µM
0.25
1.5
6.5
544.9
0.75
54.2
7.5
455.1
1.5
195.6
8.5
453.1
2.5
369.1
9.5
444.7
3.5
521.4
10.5
408.4
4.5
490.6
11.5
393.8
5.5
571.2
12.5
425.0
Deep-sea Deep-sea Deep-sea
Co-rich Baltic Sea Submarine
Vani
NASC
nodule
nodule
nodule
Mn crust ferromanhydro- Mn deposit
SW Pacific CC FZ Peru Basin
ganese
thermal
concretion
crust
s ource of data
a
b
b
c
d
e
f
g
La
167
93
55
287
24.1
38.1
19.2
31.1
Ce
952
344
112
1277
40.8
80.8
28
66.7
Nd
183
134
46
260
20.9
39.1
11.2
27.4
Sm
40
33.3
12.3
50.5
4.58
8.44
2.2
5.59
Eu
10.7
7.8
3.0
14.0
1.08
2.51
3.3
1.18
Gd
n.a.
n.a.
n.a.
60.8
4.46
7.54
2.9
5.5
Tb
6.5
4.0
1.9
n.a.
0.63
1.09
0.2
0.85
Dy
n.a.
n.a.
n.a.
48.7
3.42
6.38
2.4
5.54
Er
n.a.
n.a.
n.a.
26.5
1.92
3.15
1.6
3.27
Yb
19.5
12.9
8.7
25.3
2.1
2.64
1.6
3.06
Lu
2.9
1.8
1.4
3.57
0.29
0.36
0.2
0.456
11.5
Problems
Table 11.7 Measured pore water manganese concentrations in reducing sediment at the deepest station in
the upper basin of Loch Etive, Scotland.
Problem 4
Plot the NASC-normalized REE distribution patterns
(Table 11.8) for the following types of submarine and
subaerial Mn deposits. Remember to include all REE
on the x-axis, even those elements that have not been
analyzed. What do these REE patterns tell us about
the modes of formation of these various manganese
deposits?
Problem 5
Radiometric dating has revealed wide variations
(by four orders of magnitude) for the growth rates of
marine manganese deposits: Co-rich Mn crusts (0.8
mm Ma
-1
; Puteanus and Halbach 1988), deep-sea
manganese nodules on red clay substrates (1-2 mm
Ma
-1
; Hu and Ku 1984), deep-sea manganese nodules
on siliceous ooze substrates (3-8 mm Ma
-1
; Hu and Ku
1984), deep-sea manganese nodules on hemipelagic
clay substrates (20-50 mm Ma
-1
; Hu and Ku 1984), Baltic
Sea concretions from 1,700-21,000 mm Ma
-1
; Liebetrau
et al. 2002) and submarine hydrothermal manganese
crusts >1,000 mm Ma
-1
. These growth rates vary by a
four orders of magnitude. How do you account for
such wide variations in growth rates?
Table 11.8
REE distribution patterns for submarine and subaerial Mn deposits.
Source of data: a Kunzendorf et al. (1993), b Glasby et al. (1987), c De Carlo and McMurtry (1992), d Szefer et al.
(1998), e Glasby et al. (1997), f Glasby et al. (2004), g Gromet et al. (1984) n.a. = not analyzed.
Acknowledgements
The author would like to thank Professor G.M.
McMurtry (University of Hawaii), Dr C.L. Morgan
(Planning Solutions, Hawaii), Professor A. Usui
(Koichi University) and Dr U. von Stackelberg (BGR)
for their reviews of the manuscript. The author is also
greatly indebted to Dr S.I. Andreev, Dr J. Fenner,
Professor M. Frank, Dr J.R. Hein, Dr J. Overnell, Dr I.
Pulyaeva, Dr V.V. Shilov, Dr I.M. Varentsov and Dr J.
Wiltshire for their helpful contributions.
De pth
Mn
2+
De pth
Mn
2+
cm
µM
cm
µM
0.25
1.5
6.5
544.9
0.75
54.2
7.5
455.1
1.5
195.6
8.5
453.1
2.5
369.1
9.5
444.7
3.5
521.4
10.5
408.4
4.5
490.6
11.5
393.8
5.5
571.2
12.5
425.0
Deep-sea Deep-sea Deep-sea
Co-rich Baltic Sea Submarine
Vani
NASC
nodule
nodule
nodule
Mn crust ferromanhydro- Mn deposit
SW Pacific CC FZ Peru Basin
ganese
thermal
concretion
crust
s ource of data
a
b
b
c
d
e
f
g
La
167
93
55
287
24.1
38.1
19.2
31.1
Ce
952
344
112
1277
40.8
80.8
28
66.7
Nd
183
134
46
260
20.9
39.1
11.2
27.4
Sm
40
33.3
12.3
50.5
4.58
8.44
2.2
5.59
Eu
10.7
7.8
3.0
14.0
1.08
2.51
3.3
1.18
Gd
n.a.
n.a.
n.a.
60.8
4.46
7.54
2.9
5.5
Tb
6.5
4.0
1.9
n.a.
0.63
1.09
0.2
0.85
Dy
n.a.
n.a.
n.a.
48.7
3.42
6.38
2.4
5.54
Er
n.a.
n.a.
n.a.
26.5
1.92
3.15
1.6
3.27
Yb
19.5
12.9
8.7
25.3
2.1
2.64
1.6
3.06
Lu
2.9
1.8
1.4
3.57
0.29
0.36
0.2
0.456
11.5
Problems