

416
11 Manganese: Predominant Role of Nodules and Crusts
Problem 2
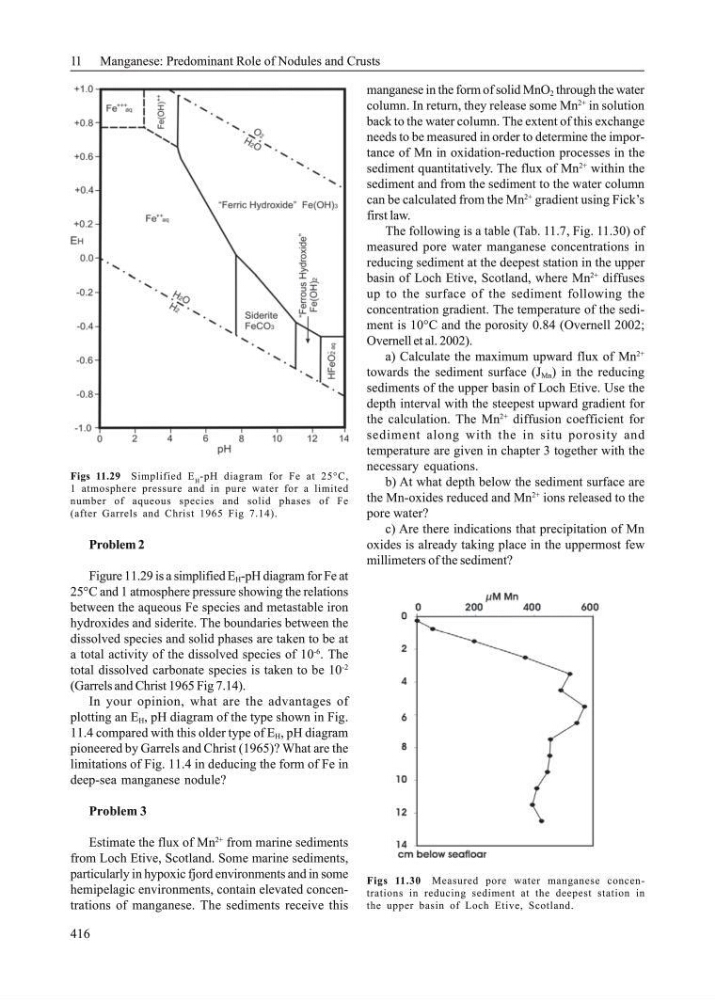
Figure 11.29 is a simplified E H -pH diagram for Fe at
25°C and 1 atmosphere pressure showing the relations
between the aqueous Fe species and metastable iron
hydroxides and siderite. The boundaries between the
dissolved species and solid phases are taken to be at
a total activity of the dissolved species of 10
-6
. The
total dissolved carbonate species is taken to be 10
-2
(Garrels and Christ 1965 Fig 7.14).
In your opinion, what are the advantages of
plotting an E H , pH diagram of the type shown in Fig.
11.4 compared with this older type of E H , pH diagram
pioneered by Garrels and Christ (1965)? What are the
limitations of Fig. 11.4 in deducing the form of Fe in
deep-sea manganese nodule?
Problem 3
Estimate the flux of Mn
2+
from marine sediments
from Loch Etive, Scotland. Some marine sediments,
particularly in hypoxic fjord environments and in some
hemipelagic environments, contain elevated concentrations of manganese. The sediments receive this
Figs 11.29 Simplified E H -pH diagram for Fe at 25°C,
1 atmosphere pressure and in pure water for a limited
number of aqueous species and solid phases of Fe
(after Garrels and Christ 1965 Fig 7.14).
manganese in the form of solid MnO 2 through the water
column. In return, they release some Mn
2+
in solution
back to the water column. The extent of this exchange
needs to be measured in order to determine the importance of Mn in oxidation-reduction processes in the
sediment quantitatively. The flux of Mn
2+
within the
sediment and from the sediment to the water column
can be calculated from the Mn
2+
gradient using Fick’s
first law.
The following is a table (Tab. 11.7, Fig. 11.30) of
measured pore water manganese concentrations in
reducing sediment at the deepest station in the upper
basin of Loch Etive, Scotland, where Mn
2+
diffuses
up to the surface of the sediment following the
concentration gradient. The temperature of the sediment is 10°C and the porosity 0.84 (Overnell 2002;
Overnell et al. 2002).
a) Calculate the maximum upward flux of Mn
2+
towards the sediment surface (J Mn ) in the reducing
sediments of the upper basin of Loch Etive. Use the
depth interval with the steepest upward gradient for
the calculation. The Mn
2+
diffusion coefficient for
sediment along with the in situ porosity and
temperature are given in chapter 3 together with the
necessary equations.
b) At what depth below the sediment surface are
the Mn-oxides reduced and Mn
2+
ions released to the
pore water?
c) Are there indications that precipitation of Mn
oxides is already taking place in the uppermost few
millimeters of the sediment?
Figs 11.30 Measured pore water manganese concentrations in reducing sediment at the deepest station in
the upper basin of Loch Etive, Scotland.
11 Manganese: Predominant Role of Nodules and Crusts
Problem 2
Figure 11.29 is a simplified E H -pH diagram for Fe at
25°C and 1 atmosphere pressure showing the relations
between the aqueous Fe species and metastable iron
hydroxides and siderite. The boundaries between the
dissolved species and solid phases are taken to be at
a total activity of the dissolved species of 10
-6
. The
total dissolved carbonate species is taken to be 10
-2
(Garrels and Christ 1965 Fig 7.14).
In your opinion, what are the advantages of
plotting an E H , pH diagram of the type shown in Fig.
11.4 compared with this older type of E H , pH diagram
pioneered by Garrels and Christ (1965)? What are the
limitations of Fig. 11.4 in deducing the form of Fe in
deep-sea manganese nodule?
Problem 3
Estimate the flux of Mn
2+
from marine sediments
from Loch Etive, Scotland. Some marine sediments,
particularly in hypoxic fjord environments and in some
hemipelagic environments, contain elevated concentrations of manganese. The sediments receive this
Figs 11.29 Simplified E H -pH diagram for Fe at 25°C,
1 atmosphere pressure and in pure water for a limited
number of aqueous species and solid phases of Fe
(after Garrels and Christ 1965 Fig 7.14).
manganese in the form of solid MnO 2 through the water
column. In return, they release some Mn
2+
in solution
back to the water column. The extent of this exchange
needs to be measured in order to determine the importance of Mn in oxidation-reduction processes in the
sediment quantitatively. The flux of Mn
2+
within the
sediment and from the sediment to the water column
can be calculated from the Mn
2+
gradient using Fick’s
first law.
The following is a table (Tab. 11.7, Fig. 11.30) of
measured pore water manganese concentrations in
reducing sediment at the deepest station in the upper
basin of Loch Etive, Scotland, where Mn
2+
diffuses
up to the surface of the sediment following the
concentration gradient. The temperature of the sediment is 10°C and the porosity 0.84 (Overnell 2002;
Overnell et al. 2002).
a) Calculate the maximum upward flux of Mn
2+
towards the sediment surface (J Mn ) in the reducing
sediments of the upper basin of Loch Etive. Use the
depth interval with the steepest upward gradient for
the calculation. The Mn
2+
diffusion coefficient for
sediment along with the in situ porosity and
temperature are given in chapter 3 together with the
necessary equations.
b) At what depth below the sediment surface are
the Mn-oxides reduced and Mn
2+
ions released to the
pore water?
c) Are there indications that precipitation of Mn
oxides is already taking place in the uppermost few
millimeters of the sediment?
Figs 11.30 Measured pore water manganese concentrations in reducing sediment at the deepest station in
the upper basin of Loch Etive, Scotland.