

8
Sulfur Cycling and Methane Oxidation
284
and Skagerrak sediments methane oxidation
accounted for only 10 % of the electron donor
requirement for the depth integrated sulfate reduction. In this case sulfate reduction rates were measured by radiotracer technique throughout the
entire sulfate zone.
The proportion of sulfate used for organic
matter degradation in comparison to sulfate used
for anaerobic methane oxidation may be calculated
under molecular diffusion conditions from the
shape of sulfate profiles. Borowski et al. (1996)
inferred that the linear sulfate pore water concentration profiles found in Carolina Rise and Blake
Ridge sediments imply that anaerobic methane
oxidation is the dominant sulfate consuming
process. They calculated the upward methane flux
from measured sulfate pore water profiles
assuming that the downward sulfate flux is
stoichiometrically balanced by upward methane
flux. In this way they used the sulfate concentration profiles to calculate the methane flux from
the underlying methane gas hydrates which had
been documented by seismic profiling. Niewöhner
et al. (1998) found similar linear sulfate concentration profiles in sediments of the Benguela
upwelling area (see Fig. 8.6) and concluded that
anaerobic methane oxidation could account for the
entire deep sulfate flux.
These studies demonstrate that the sulfateconsuming process occurring in the deeper
sediments, i.e. AOM, is the dominant factor determining the shape of the sulfate pore water
profiles, although oxidation of organic matter
demonstrably occurs throughout the entire sulfate
zone. Linear sulfate profiles can, therefore, be
used to calculate the upward methane flux (e.g.
Devol and Ahmed 1981; Borowski et al. 1996;
Niewöhner et al. 1998) but they do not provide
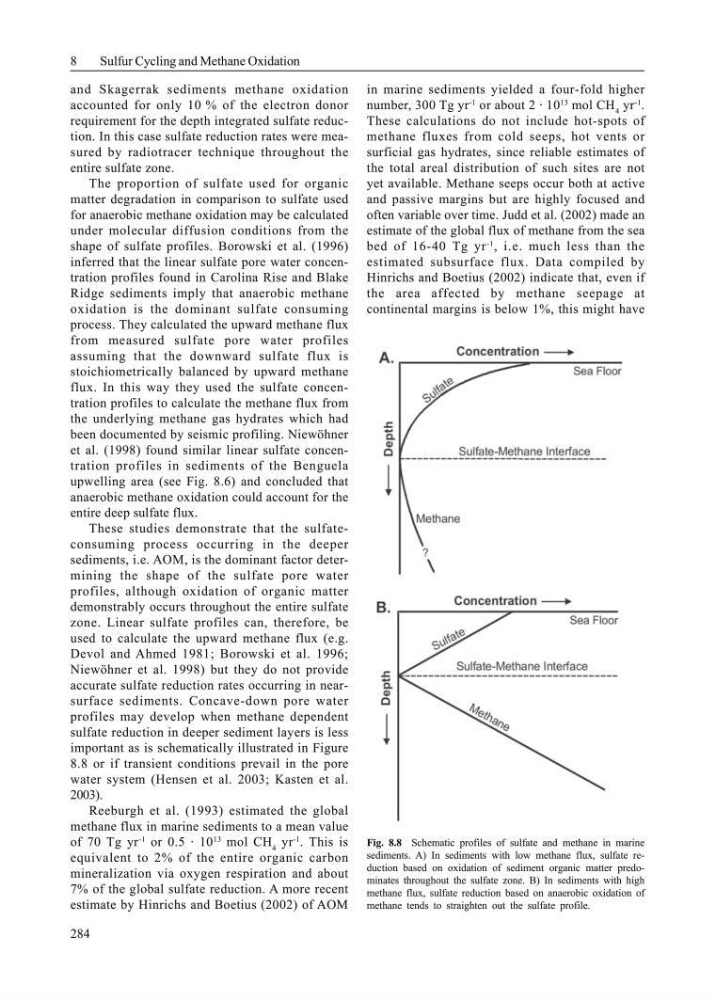
accurate sulfate reduction rates occurring in nearsurface sediments. Concave-down pore water
profiles may develop when methane dependent
sulfate reduction in deeper sediment layers is less
important as is schematically illustrated in Figure
8.8 or if transient conditions prevail in the pore
water system (Hensen et al. 2003; Kasten et al.
2003).
Reeburgh et al. (1993) estimated the global
methane flux in marine sediments to a mean value
of 70 Tg yr
-1
or 0.5 · 10
13
mol CH 4 yr
-1
. This is
equivalent to 2% of the entire organic carbon
mineralization via oxygen respiration and about
7% of the global sulfate reduction. A more recent
estimate by Hinrichs and Boetius (2002) of AOM
in marine sediments yielded a four-fold higher
number, 300 Tg yr
-1
or about 2 · 10
13
mol CH 4 yr
-1
.
These calculations do not include hot-spots of
methane fluxes from cold seeps, hot vents or
surficial gas hydrates, since reliable estimates of
the total areal distribution of such sites are not
yet available. Methane seeps occur both at active
and passive margins but are highly focused and
often variable over time. Judd et al. (2002) made an
estimate of the global flux of methane from the sea
bed of 16-40 Tg yr
-1
, i.e. much less than the
estimated subsurface flux. Data compiled by
Hinrichs and Boetius (2002) indicate that, even if
the area affected by methane seepage at
continental margins is below 1%, this might have
Fig. 8.8 Schematic profiles of sulfate and methane in marine
sediments. A) In sediments with low methane flux, sulfate reduction based on oxidation of sediment organic matter predominates throughout the sulfate zone. B) In sediments with high
methane flux, sulfate reduction based on anaerobic oxidation of
methane tends to straighten out the sulfate profile.
Sulfur Cycling and Methane Oxidation
284
and Skagerrak sediments methane oxidation
accounted for only 10 % of the electron donor
requirement for the depth integrated sulfate reduction. In this case sulfate reduction rates were measured by radiotracer technique throughout the
entire sulfate zone.
The proportion of sulfate used for organic
matter degradation in comparison to sulfate used
for anaerobic methane oxidation may be calculated
under molecular diffusion conditions from the
shape of sulfate profiles. Borowski et al. (1996)
inferred that the linear sulfate pore water concentration profiles found in Carolina Rise and Blake
Ridge sediments imply that anaerobic methane
oxidation is the dominant sulfate consuming
process. They calculated the upward methane flux
from measured sulfate pore water profiles
assuming that the downward sulfate flux is
stoichiometrically balanced by upward methane
flux. In this way they used the sulfate concentration profiles to calculate the methane flux from
the underlying methane gas hydrates which had
been documented by seismic profiling. Niewöhner
et al. (1998) found similar linear sulfate concentration profiles in sediments of the Benguela
upwelling area (see Fig. 8.6) and concluded that
anaerobic methane oxidation could account for the
entire deep sulfate flux.
These studies demonstrate that the sulfateconsuming process occurring in the deeper
sediments, i.e. AOM, is the dominant factor determining the shape of the sulfate pore water
profiles, although oxidation of organic matter
demonstrably occurs throughout the entire sulfate
zone. Linear sulfate profiles can, therefore, be
used to calculate the upward methane flux (e.g.
Devol and Ahmed 1981; Borowski et al. 1996;
Niewöhner et al. 1998) but they do not provide
accurate sulfate reduction rates occurring in nearsurface sediments. Concave-down pore water
profiles may develop when methane dependent
sulfate reduction in deeper sediment layers is less
important as is schematically illustrated in Figure
8.8 or if transient conditions prevail in the pore
water system (Hensen et al. 2003; Kasten et al.
2003).
Reeburgh et al. (1993) estimated the global
methane flux in marine sediments to a mean value
of 70 Tg yr
-1
or 0.5 · 10
13
mol CH 4 yr
-1
. This is
equivalent to 2% of the entire organic carbon
mineralization via oxygen respiration and about
7% of the global sulfate reduction. A more recent
estimate by Hinrichs and Boetius (2002) of AOM
in marine sediments yielded a four-fold higher
number, 300 Tg yr
-1
or about 2 · 10
13
mol CH 4 yr
-1
.
These calculations do not include hot-spots of
methane fluxes from cold seeps, hot vents or
surficial gas hydrates, since reliable estimates of
the total areal distribution of such sites are not
yet available. Methane seeps occur both at active
and passive margins but are highly focused and
often variable over time. Judd et al. (2002) made an
estimate of the global flux of methane from the sea
bed of 16-40 Tg yr
-1
, i.e. much less than the
estimated subsurface flux. Data compiled by
Hinrichs and Boetius (2002) indicate that, even if
the area affected by methane seepage at
continental margins is below 1%, this might have
Fig. 8.8 Schematic profiles of sulfate and methane in marine
sediments. A) In sediments with low methane flux, sulfate reduction based on oxidation of sediment organic matter predominates throughout the sulfate zone. B) In sediments with high
methane flux, sulfate reduction based on anaerobic oxidation of
methane tends to straighten out the sulfate profile.