

283
methanogenesis in certain archaea (Krüger et al.
2003; Hallam et al. 2003). In this respect,
microbiological and biogeochemical research is
currently providing mutually supporting evidence
for the nature of AOM.
8.3.3
Quantitative Role of AOM
Since methane formation is largely restricted to
sediment layers below the depth of sulfate penetration, there is relatively little organic carbon with
low reactivity left to fuel methanogenesis. When
integrated through the sediment column, the
amount of organic carbon mineralized with the
formation of methane is generally only 5-20% of
that mineralized by sulfate reduction (Canfield
1993; Canfield et al. 2005; Table 8.2), with 10%
possibly representing a mean value. Since sulfate
reduction typically accounts for half of the
organic mineralization in ocean margin sediments,
it should only be about 5% of the total mineralized
organic carbon that is ultimately degraded to
methane. In deep sea sediments the fraction is
presumably lower but relevant data to confirm this
are lacking. In some coastal environments with
very high organic loading, such as Cape Lookout
Bight on the Atlantic coast of North America,
much more of the organic carbon may be buried
below the sulfate zone and be degraded to
methane (Crill and Martens 1986). Also in ocean
margin sediments where the methane flux is
enhanced due to subduction or is focused in
association with methane seeps or surficial gas
hydrate accumulations, methane may provide the
main carbon source for the entire sulfate reduction
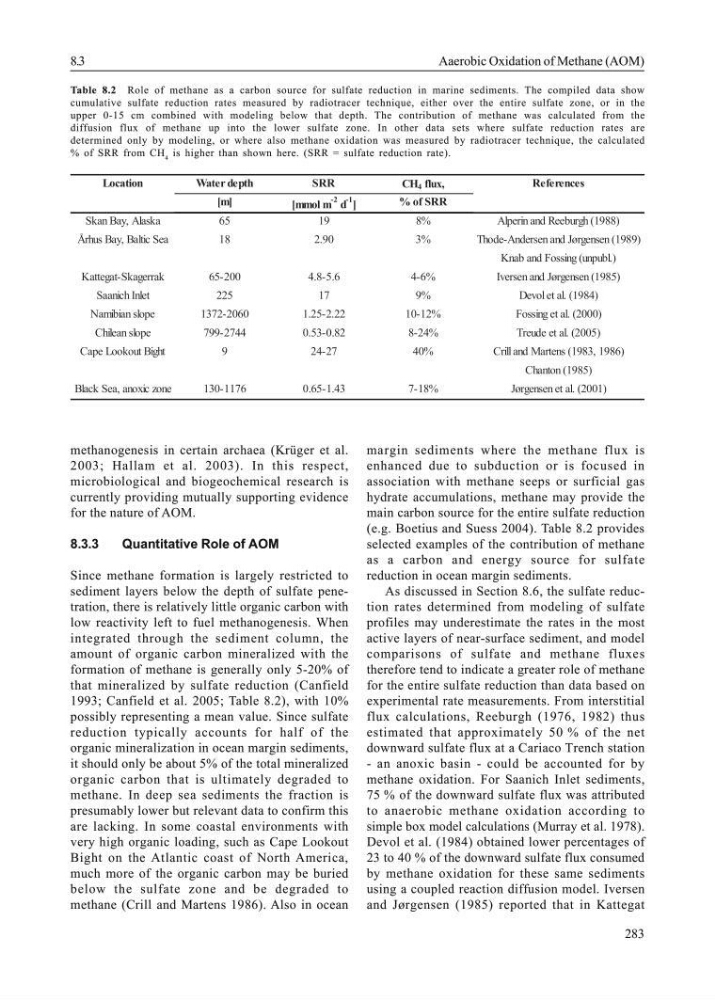
(e.g. Boetius and Suess 2004). Table 8.2 provides
selected examples of the contribution of methane
as a carbon and energy source for sulfate
reduction in ocean margin sediments.
As discussed in Section 8.6, the sulfate reduction rates determined from modeling of sulfate
profiles may underestimate the rates in the most
active layers of near-surface sediment, and model
comparisons of sulfate and methane fluxes
therefore tend to indicate a greater role of methane
for the entire sulfate reduction than data based on
experimental rate measurements. From interstitial
flux calculations, Reeburgh (1976, 1982) thus
estimated that approximately 50 % of the net
downward sulfate flux at a Cariaco Trench station
- an anoxic basin - could be accounted for by
methane oxidation. For Saanich Inlet sediments,
75 % of the downward sulfate flux was attributed
to anaerobic methane oxidation according to
simple box model calculations (Murray et al. 1978).
Devol et al. (1984) obtained lower percentages of
23 to 40 % of the downward sulfate flux consumed
by methane oxidation for these same sediments
using a coupled reaction diffusion model. Iversen
and Jørgensen (1985) reported that in Kattegat
Table 8.2 Role of methane as a carbon source for sulfate reduction in marine sediments. The compiled data show
cumulative sulfate reduction rates measured by radiotracer technique, either over the entire sulfate zone, or in the
upper 0-15 cm combined with modeling below that depth. The contribution of methane was calculated from the
diffusion flux of methane up into the lower sulfate zone. In other data sets where sulfate reduction rates are
determined only by modeling, or where also methane oxidation was measured by radiotracer technique, the calculated
% of SRR from CH 4 is higher than shown here. (SRR = sulfate reduction rate).
8.3
Aaerobic Oxidation of Methane (AOM)
Water depth
SRR
CH 4 flux,
[m]
[mmol m
-2 d
-1 ]
% of SRR
Skan Bay, Alaska
65
19
8%
Alperin and Reeburgh (1988)
Thode-Andersen and Jørgensen (1989)
Knab and Fossing (unpubl.)
Kattegat-Skagerrak
65-200
4.8-5.6
4-6%
Iversen and Jørgensen (1985)
Saanich Inlet
225
17
9%
Devol et al. (1984)
Namibian slope
1372-2060
1.25-2.22
10-12%
Fossing et al. (2000)
Chilean slope
799-2744
0.53-0.82
8-24%
Treude et al. (2005)
Crill and Martens (1983, 1986)
Chanton (1985)
Black Sea, anoxic zone
130-1176
0.65-1.43
7-18%
Jørgensen et al. (2001)
Cape Lookout Bight
9
24-27
40%
Location
References
Århus Bay, Baltic Sea
18
2.90
3%
methanogenesis in certain archaea (Krüger et al.
2003; Hallam et al. 2003). In this respect,
microbiological and biogeochemical research is
currently providing mutually supporting evidence
for the nature of AOM.
8.3.3
Quantitative Role of AOM
Since methane formation is largely restricted to
sediment layers below the depth of sulfate penetration, there is relatively little organic carbon with
low reactivity left to fuel methanogenesis. When
integrated through the sediment column, the
amount of organic carbon mineralized with the
formation of methane is generally only 5-20% of
that mineralized by sulfate reduction (Canfield
1993; Canfield et al. 2005; Table 8.2), with 10%
possibly representing a mean value. Since sulfate
reduction typically accounts for half of the
organic mineralization in ocean margin sediments,
it should only be about 5% of the total mineralized
organic carbon that is ultimately degraded to
methane. In deep sea sediments the fraction is
presumably lower but relevant data to confirm this
are lacking. In some coastal environments with
very high organic loading, such as Cape Lookout
Bight on the Atlantic coast of North America,
much more of the organic carbon may be buried
below the sulfate zone and be degraded to
methane (Crill and Martens 1986). Also in ocean
margin sediments where the methane flux is
enhanced due to subduction or is focused in
association with methane seeps or surficial gas
hydrate accumulations, methane may provide the
main carbon source for the entire sulfate reduction
(e.g. Boetius and Suess 2004). Table 8.2 provides
selected examples of the contribution of methane
as a carbon and energy source for sulfate
reduction in ocean margin sediments.
As discussed in Section 8.6, the sulfate reduction rates determined from modeling of sulfate
profiles may underestimate the rates in the most
active layers of near-surface sediment, and model
comparisons of sulfate and methane fluxes
therefore tend to indicate a greater role of methane
for the entire sulfate reduction than data based on
experimental rate measurements. From interstitial
flux calculations, Reeburgh (1976, 1982) thus
estimated that approximately 50 % of the net
downward sulfate flux at a Cariaco Trench station
- an anoxic basin - could be accounted for by
methane oxidation. For Saanich Inlet sediments,
75 % of the downward sulfate flux was attributed
to anaerobic methane oxidation according to
simple box model calculations (Murray et al. 1978).
Devol et al. (1984) obtained lower percentages of
23 to 40 % of the downward sulfate flux consumed
by methane oxidation for these same sediments
using a coupled reaction diffusion model. Iversen
and Jørgensen (1985) reported that in Kattegat
Table 8.2 Role of methane as a carbon source for sulfate reduction in marine sediments. The compiled data show
cumulative sulfate reduction rates measured by radiotracer technique, either over the entire sulfate zone, or in the
upper 0-15 cm combined with modeling below that depth. The contribution of methane was calculated from the
diffusion flux of methane up into the lower sulfate zone. In other data sets where sulfate reduction rates are
determined only by modeling, or where also methane oxidation was measured by radiotracer technique, the calculated
% of SRR from CH 4 is higher than shown here. (SRR = sulfate reduction rate).
8.3
Aaerobic Oxidation of Methane (AOM)
Water depth
SRR
CH 4 flux,
[m]
[mmol m
-2 d
-1 ]
% of SRR
Skan Bay, Alaska
65
19
8%
Alperin and Reeburgh (1988)
Thode-Andersen and Jørgensen (1989)
Knab and Fossing (unpubl.)
Kattegat-Skagerrak
65-200
4.8-5.6
4-6%
Iversen and Jørgensen (1985)
Saanich Inlet
225
17
9%
Devol et al. (1984)
Namibian slope
1372-2060
1.25-2.22
10-12%
Fossing et al. (2000)
Chilean slope
799-2744
0.53-0.82
8-24%
Treude et al. (2005)
Crill and Martens (1983, 1986)
Chanton (1985)
Black Sea, anoxic zone
130-1176
0.65-1.43
7-18%
Jørgensen et al. (2001)
Cape Lookout Bight
9
24-27
40%
Location
References
Århus Bay, Baltic Sea
18
2.90
3%