

259
period of 4 to 5 times of the radioactive half-life
which is approximately 100 years in case of
210
Pb.
In Figure 7.19 a typical
210
Pb-activity depth
profile from the Washington shelf is shown. The
uppermost 9 cm are characterized by constant
210
Pb activity implying intensive mixing in the
surface layer. Below,
210
Pb activity decreases
linearly (on a log-scale) indicating no mixing and
continuous decay. The lowest part of the profile
is characterized by constantly very low values
resulting from the long-term decay of
226
Ra to
210
Pb in the sediment. This background value is
subtracted from the above activities, which are
then termed excess210
Pb or unsupported210
Pb.
The depth interval showing a linear decrease on a
log-activity scale is often used to calculate a
sedimentation rate. Yet, a strong overestimation
of the true sedimentation rate is possible as slight
deep bioturbation in this part may not be seen
exclusively by
210
Pb as it was shown by Aller and
DeMaster (1984). The investigation of an
additional, shorter-lived isotope within this depth
interval will reveal a potential influence of bioturbation.
As mentioned in the beginning of this section
bioturbation and advection by sedimentation
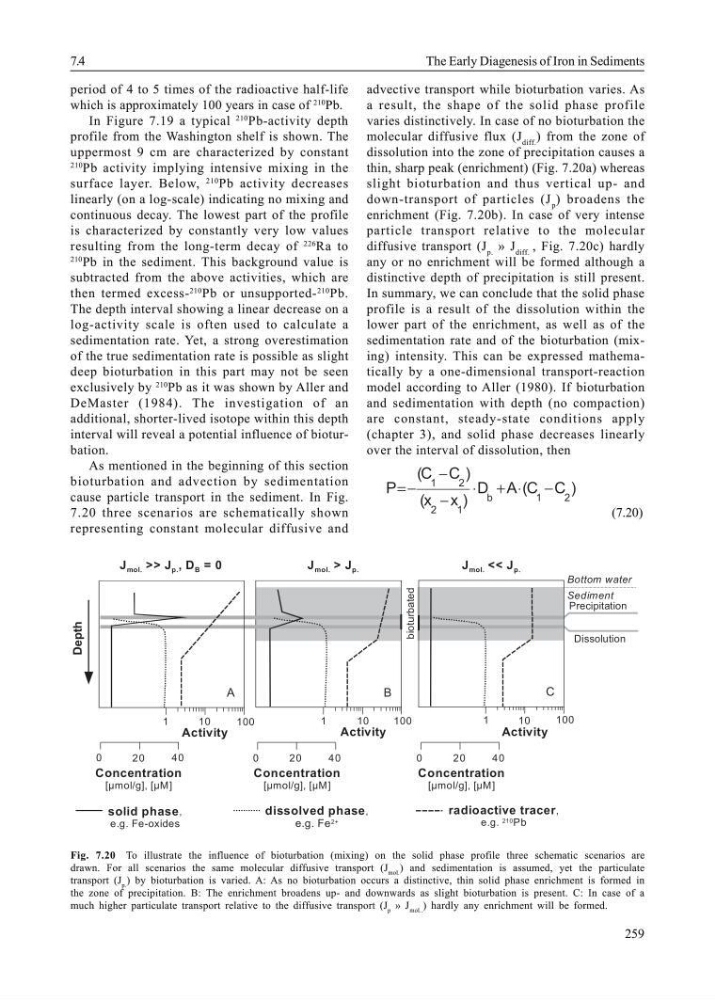
cause particle transport in the sediment. In Fig.
7.20 three scenarios are schematically shown
representing constant molecular diffusive and
advective transport while bioturbation varies. As
a result, the shape of the solid phase profile
varies distinctively. In case of no bioturbation the
molecular diffusive flux (J diff. ) from the zone of
dissolution into the zone of precipitation causes a
thin, sharp peak (enrichment) (Fig. 7.20a) whereas
slight bioturbation and thus vertical up- and
down-transport of particles (J p ) broadens the
enrichment (Fig. 7.20b). In case of very intense
particle transport relative to the molecular
diffusive transport (J p. » J diff. , Fig. 7.20c) hardly
any or no enrichment will be formed although a
distinctive depth of precipitation is still present.
In summary, we can conclude that the solid phase
profile is a result of the dissolution within the
lower part of the enrichment, as well as of the
sedimentation rate and of the bioturbation (mixing) intensity. This can be expressed mathematically by a one-dimensional transport-reaction
model according to Aller (1980). If bioturbation
and sedimentation with depth (no compaction)
are constant, steady-state conditions apply
(chapter 3), and solid phase decreases linearly
over the interval of dissolution, then
P
(C C )
(x x )
D A (C C )
1
2
2
1
b
1
2
=−
−
−
⋅ + ⋅ −
(7.20)
7.4
The Early Diagenesis of Iron in Sediments
Fig. 7.22
Precipitation
Dissolution
Depth
Activity
bioturbated
solid phase,
e.g. Fe-oxides
dissolved phase,
e.g. Fe 2+
radioactive tracer,
e.g. 210 Pb
1
10
100
1
10
100
1
1 0
100
0
20
40
Concentration
[µmol/g], [µM]
0
20
40
0
20
40
Activity
Activity
A
B
C
Bottom water
Sediment
J mol. >> J p. , D B = 0
J mol. > J p.
J mol. << J p.
Concentration
[µmol/g], [µM]
Concentration
[µmol/g], [µM]
Fig. 7.20 To illustrate the influence of bioturbation (mixing) on the solid phase profile three schematic scenarios are
drawn. For all scenarios the same molecular diffusive transport (J mol. ) and sedimentation is assumed, yet the particulate
transport (J p. ) by bioturbation is varied. A: As no bioturbation occurs a distinctive, thin solid phase enrichment is formed in
the zone of precipitation. B: The enrichment broadens up- and downwards as slight bioturbation is present. C: In case of a
much higher particulate transport relative to the diffusive transport (J p » J mol.. ) hardly any enrichment will be formed.
period of 4 to 5 times of the radioactive half-life
which is approximately 100 years in case of
210
Pb.
In Figure 7.19 a typical
210
Pb-activity depth
profile from the Washington shelf is shown. The
uppermost 9 cm are characterized by constant
210
Pb activity implying intensive mixing in the
surface layer. Below,
210
Pb activity decreases
linearly (on a log-scale) indicating no mixing and
continuous decay. The lowest part of the profile
is characterized by constantly very low values
resulting from the long-term decay of
226
Ra to
210
Pb in the sediment. This background value is
subtracted from the above activities, which are
then termed excess210
Pb or unsupported210
Pb.
The depth interval showing a linear decrease on a
log-activity scale is often used to calculate a
sedimentation rate. Yet, a strong overestimation
of the true sedimentation rate is possible as slight
deep bioturbation in this part may not be seen
exclusively by
210
Pb as it was shown by Aller and
DeMaster (1984). The investigation of an
additional, shorter-lived isotope within this depth
interval will reveal a potential influence of bioturbation.
As mentioned in the beginning of this section
bioturbation and advection by sedimentation
cause particle transport in the sediment. In Fig.
7.20 three scenarios are schematically shown
representing constant molecular diffusive and
advective transport while bioturbation varies. As
a result, the shape of the solid phase profile
varies distinctively. In case of no bioturbation the
molecular diffusive flux (J diff. ) from the zone of
dissolution into the zone of precipitation causes a
thin, sharp peak (enrichment) (Fig. 7.20a) whereas
slight bioturbation and thus vertical up- and
down-transport of particles (J p ) broadens the
enrichment (Fig. 7.20b). In case of very intense
particle transport relative to the molecular
diffusive transport (J p. » J diff. , Fig. 7.20c) hardly
any or no enrichment will be formed although a
distinctive depth of precipitation is still present.
In summary, we can conclude that the solid phase
profile is a result of the dissolution within the
lower part of the enrichment, as well as of the
sedimentation rate and of the bioturbation (mixing) intensity. This can be expressed mathematically by a one-dimensional transport-reaction
model according to Aller (1980). If bioturbation
and sedimentation with depth (no compaction)
are constant, steady-state conditions apply
(chapter 3), and solid phase decreases linearly
over the interval of dissolution, then
P
(C C )
(x x )
D A (C C )
1
2
2
1
b
1
2
=−
−
−
⋅ + ⋅ −
(7.20)
7.4
The Early Diagenesis of Iron in Sediments
Fig. 7.22
Precipitation
Dissolution
Depth
Activity
bioturbated
solid phase,
e.g. Fe-oxides
dissolved phase,
e.g. Fe 2+
radioactive tracer,
e.g. 210 Pb
1
10
100
1
10
100
1
1 0
100
0
20
40
Concentration
[µmol/g], [µM]
0
20
40
0
20
40
Activity
Activity
A
B
C
Bottom water
Sediment
J mol. >> J p. , D B = 0
J mol. > J p.
J mol. << J p.
Concentration
[µmol/g], [µM]
Concentration
[µmol/g], [µM]
Fig. 7.20 To illustrate the influence of bioturbation (mixing) on the solid phase profile three schematic scenarios are
drawn. For all scenarios the same molecular diffusive transport (J mol. ) and sedimentation is assumed, yet the particulate
transport (J p. ) by bioturbation is varied. A: As no bioturbation occurs a distinctive, thin solid phase enrichment is formed in
the zone of precipitation. B: The enrichment broadens up- and downwards as slight bioturbation is present. C: In case of a
much higher particulate transport relative to the diffusive transport (J p » J mol.. ) hardly any enrichment will be formed.