

6
Benthic Cycling of Oxygen, Nitrogen and Phosphorus
232
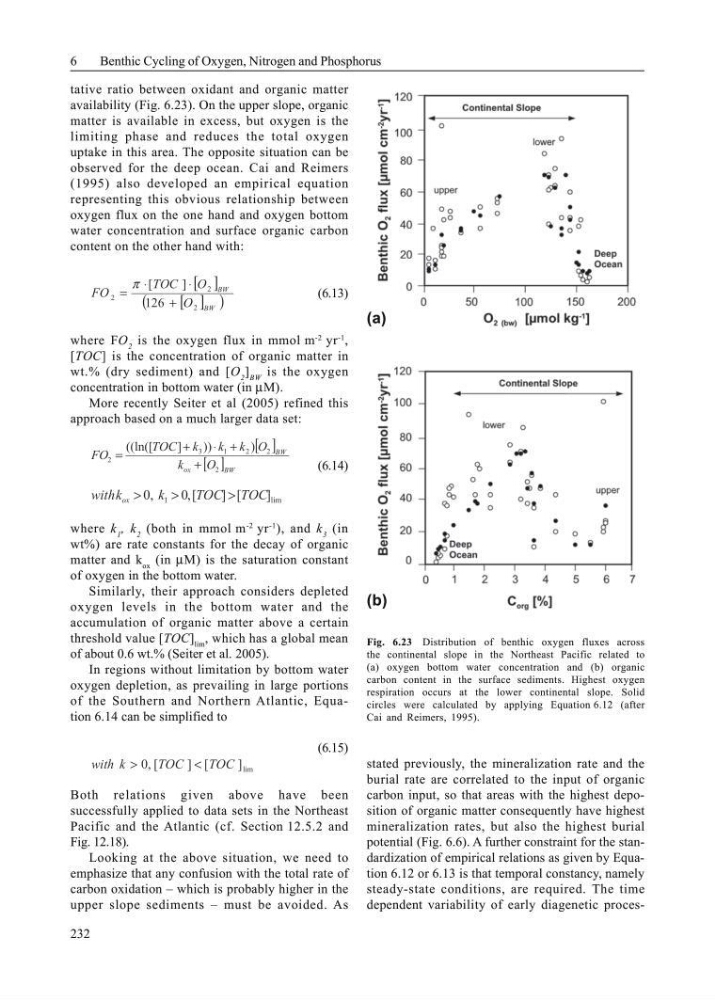
tative ratio between oxidant and organic matter
availability (Fig. 6.23). On the upper slope, organic
matter is available in excess, but oxygen is the
limiting phase and reduces the total oxygen
uptake in this area. The opposite situation can be
observed for the deep ocean. Cai and Reimers
(1995) also developed an empirical equation
representing this obvious relationship between
oxygen flux on the one hand and oxygen bottom
water concentration and surface organic carbon
content on the other hand with:
[ ]
[ ]
(
)
BW
BW
O
O
TOC
FO
2
2
2
126
]
[
+
⋅
⋅
=
π
(6.13)
where FO 2 is the oxygen flux in mmol m
-2
yr
-1
,
[TOC] is the concentration of organic matter in
wt.% (dry sediment) and [O 2 ] BW is the oxygen
concentration in bottom water (in µM).
More recently Seiter et al (2005) refined this
approach based on a much larger data set:
[ ]
[ ] BW
ox
BW
O
k
O
k
k
k
TOC
FO
2
2
2
1
3
2
)
))
]
((ln([
+
+
⋅
+
=
(6.14)
lim
1
]
[
]
[
,
0
0,
TOC
TOC
k
k
with ox
>
>
>
where k 1 , k 2 (both in mmol m
-2
yr
-1
), and k 3 (in
wt%) are rate constants for the decay of organic
matter and k ox (in µM) is the saturation constant
of oxygen in the bottom water.
Similarly, their approach considers depleted
oxygen levels in the bottom water and the
accumulation of organic matter above a certain
threshold value [TOC] lim , which has a global mean
of about 0.6 wt.% (Seiter et al. 2005).
In regions without limitation by bottom water
oxygen depletion, as prevailing in large portions
of the Southern and Northern Atlantic, Equation 6.14 can be simplified to
(6.15)
lim
]
[
]
[
0,
TOC
TOC
k
with
<
>
Both relations given above have been
successfully applied to data sets in the Northeast
Pacific and the Atlantic (cf. Section 12.5.2 and
Fig. 12.18).
Looking at the above situation, we need to
emphasize that any confusion with the total rate of
carbon oxidation – which is probably higher in the
upper slope sediments – must be avoided. As
stated previously, the mineralization rate and the
burial rate are correlated to the input of organic
carbon input, so that areas with the highest deposition of organic matter consequently have highest
mineralization rates, but also the highest burial
potential (Fig. 6.6). A further constraint for the standardization of empirical relations as given by Equation 6.12 or 6.13 is that temporal constancy, namely
steady-state conditions, are required. The time
dependent variability of early diagenetic procesFig. 6.23 Distribution of benthic oxygen fluxes across
the continental slope in the Northeast Pacific related to
(a) oxygen bottom water concentration and (b) organic
carbon content in the surface sediments. Highest oxygen
respiration occurs at the lower continental slope. Solid
circles were calculated by applying Equation 6.12 (after
Cai and Reimers, 1995).
(b)
(a)
Benthic Cycling of Oxygen, Nitrogen and Phosphorus
232
tative ratio between oxidant and organic matter
availability (Fig. 6.23). On the upper slope, organic
matter is available in excess, but oxygen is the
limiting phase and reduces the total oxygen
uptake in this area. The opposite situation can be
observed for the deep ocean. Cai and Reimers
(1995) also developed an empirical equation
representing this obvious relationship between
oxygen flux on the one hand and oxygen bottom
water concentration and surface organic carbon
content on the other hand with:
[ ]
[ ]
(
)
BW
BW
O
O
TOC
FO
2
2
2
126
]
[
+
⋅
⋅
=
π
(6.13)
where FO 2 is the oxygen flux in mmol m
-2
yr
-1
,
[TOC] is the concentration of organic matter in
wt.% (dry sediment) and [O 2 ] BW is the oxygen
concentration in bottom water (in µM).
More recently Seiter et al (2005) refined this
approach based on a much larger data set:
[ ]
[ ] BW
ox
BW
O
k
O
k
k
k
TOC
FO
2
2
2
1
3
2
)
))
]
((ln([
+
+
⋅
+
=
(6.14)
lim
1
]
[
]
[
,
0
0,
TOC
TOC
k
k
with ox
>
>
>
where k 1 , k 2 (both in mmol m
-2
yr
-1
), and k 3 (in
wt%) are rate constants for the decay of organic
matter and k ox (in µM) is the saturation constant
of oxygen in the bottom water.
Similarly, their approach considers depleted
oxygen levels in the bottom water and the
accumulation of organic matter above a certain
threshold value [TOC] lim , which has a global mean
of about 0.6 wt.% (Seiter et al. 2005).
In regions without limitation by bottom water
oxygen depletion, as prevailing in large portions
of the Southern and Northern Atlantic, Equation 6.14 can be simplified to
(6.15)
lim
]
[
]
[
0,
TOC
TOC
k
with
<
>
Both relations given above have been
successfully applied to data sets in the Northeast
Pacific and the Atlantic (cf. Section 12.5.2 and
Fig. 12.18).
Looking at the above situation, we need to
emphasize that any confusion with the total rate of
carbon oxidation – which is probably higher in the
upper slope sediments – must be avoided. As
stated previously, the mineralization rate and the
burial rate are correlated to the input of organic
carbon input, so that areas with the highest deposition of organic matter consequently have highest
mineralization rates, but also the highest burial
potential (Fig. 6.6). A further constraint for the standardization of empirical relations as given by Equation 6.12 or 6.13 is that temporal constancy, namely
steady-state conditions, are required. The time
dependent variability of early diagenetic procesFig. 6.23 Distribution of benthic oxygen fluxes across
the continental slope in the Northeast Pacific related to
(a) oxygen bottom water concentration and (b) organic
carbon content in the surface sediments. Highest oxygen
respiration occurs at the lower continental slope. Solid
circles were calculated by applying Equation 6.12 (after
Cai and Reimers, 1995).
(b)
(a)