

231
the total South Atlantic as compiled by Wenzhöfer
and Glud (2002). Both, the diffusive oxygen flux
and the oxygen penetration depth at these
stations can be clearly described as a function of
water depth, even though scattering data points
indicate some regional variability. The evident
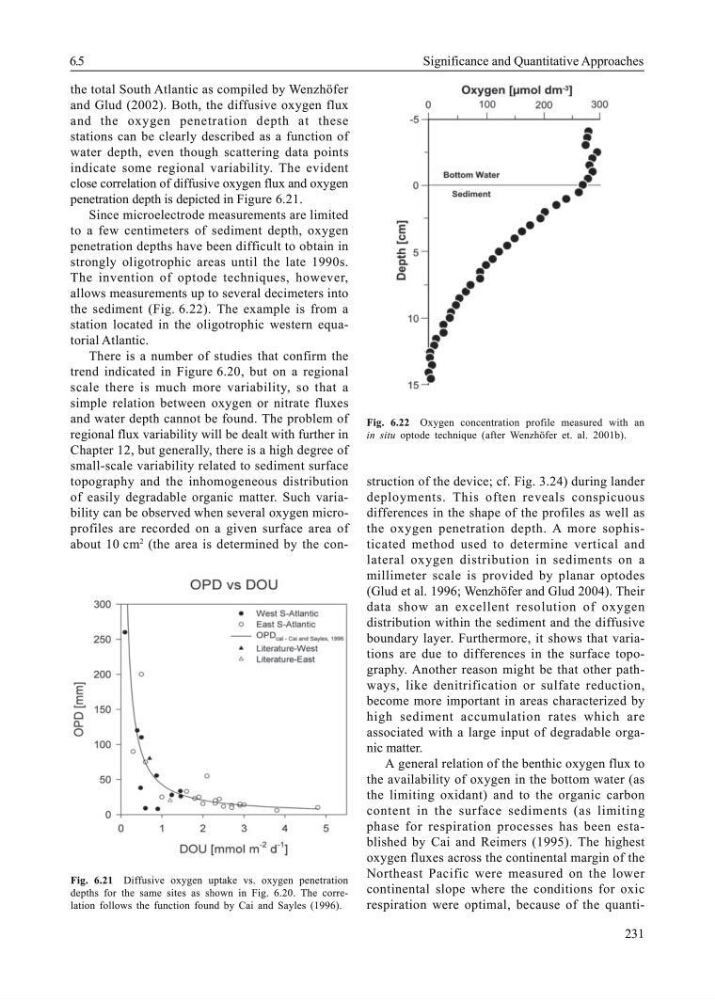
close correlation of diffusive oxygen flux and oxygen
penetration depth is depicted in Figure 6.21.
Since microelectrode measurements are limited
to a few centimeters of sediment depth, oxygen
penetration depths have been difficult to obtain in
strongly oligotrophic areas until the late 1990s.
The invention of optode techniques, however,
allows measurements up to several decimeters into
the sediment (Fig. 6.22). The example is from a
station located in the oligotrophic western equatorial Atlantic.
There is a number of studies that confirm the
trend indicated in Figure 6.20, but on a regional
scale there is much more variability, so that a
simple relation between oxygen or nitrate fluxes
and water depth cannot be found. The problem of
regional flux variability will be dealt with further in
Chapter 12, but generally, there is a high degree of
small-scale variability related to sediment surface
topography and the inhomogeneous distribution
of easily degradable organic matter. Such variability can be observed when several oxygen microprofiles are recorded on a given surface area of
about 10 cm
2
(the area is determined by the construction of the device; cf. Fig. 3.24) during lander
deployments. This often reveals conspicuous
differences in the shape of the profiles as well as
the oxygen penetration depth. A more sophisticated method used to determine vertical and
lateral oxygen distribution in sediments on a
millimeter scale is provided by planar optodes
(Glud et al. 1996; Wenzhöfer and Glud 2004). Their
data show an excellent resolution of oxygen
distribution within the sediment and the diffusive
boundary layer. Furthermore, it shows that variations are due to differences in the surface topography. Another reason might be that other pathways, like denitrification or sulfate reduction,
become more important in areas characterized by
high sediment accumulation rates which are
associated with a large input of degradable organic matter.
A general relation of the benthic oxygen flux to
the availability of oxygen in the bottom water (as
the limiting oxidant) and to the organic carbon
content in the surface sediments (as limiting
phase for respiration processes has been established by Cai and Reimers (1995). The highest
oxygen fluxes across the continental margin of the
Northeast Pacific were measured on the lower
continental slope where the conditions for oxic
respiration were optimal, because of the quantiFig. 6.21 Diffusive oxygen uptake vs. oxygen penetration
depths for the same sites as shown in Fig. 6.20. The correlation follows the function found by Cai and Sayles (1996).
Fig. 6.22 Oxygen concentration profile measured with an
in situ optode technique (after Wenzhöfer et. al. 2001b).
6.5
Significance and Quantitative Approaches
the total South Atlantic as compiled by Wenzhöfer
and Glud (2002). Both, the diffusive oxygen flux
and the oxygen penetration depth at these
stations can be clearly described as a function of
water depth, even though scattering data points
indicate some regional variability. The evident
close correlation of diffusive oxygen flux and oxygen
penetration depth is depicted in Figure 6.21.
Since microelectrode measurements are limited
to a few centimeters of sediment depth, oxygen
penetration depths have been difficult to obtain in
strongly oligotrophic areas until the late 1990s.
The invention of optode techniques, however,
allows measurements up to several decimeters into
the sediment (Fig. 6.22). The example is from a
station located in the oligotrophic western equatorial Atlantic.
There is a number of studies that confirm the
trend indicated in Figure 6.20, but on a regional
scale there is much more variability, so that a
simple relation between oxygen or nitrate fluxes
and water depth cannot be found. The problem of
regional flux variability will be dealt with further in
Chapter 12, but generally, there is a high degree of
small-scale variability related to sediment surface
topography and the inhomogeneous distribution
of easily degradable organic matter. Such variability can be observed when several oxygen microprofiles are recorded on a given surface area of
about 10 cm
2
(the area is determined by the construction of the device; cf. Fig. 3.24) during lander
deployments. This often reveals conspicuous
differences in the shape of the profiles as well as
the oxygen penetration depth. A more sophisticated method used to determine vertical and
lateral oxygen distribution in sediments on a
millimeter scale is provided by planar optodes
(Glud et al. 1996; Wenzhöfer and Glud 2004). Their
data show an excellent resolution of oxygen
distribution within the sediment and the diffusive
boundary layer. Furthermore, it shows that variations are due to differences in the surface topography. Another reason might be that other pathways, like denitrification or sulfate reduction,
become more important in areas characterized by
high sediment accumulation rates which are
associated with a large input of degradable organic matter.
A general relation of the benthic oxygen flux to
the availability of oxygen in the bottom water (as
the limiting oxidant) and to the organic carbon
content in the surface sediments (as limiting
phase for respiration processes has been established by Cai and Reimers (1995). The highest
oxygen fluxes across the continental margin of the
Northeast Pacific were measured on the lower
continental slope where the conditions for oxic
respiration were optimal, because of the quantiFig. 6.21 Diffusive oxygen uptake vs. oxygen penetration
depths for the same sites as shown in Fig. 6.20. The correlation follows the function found by Cai and Sayles (1996).
Fig. 6.22 Oxygen concentration profile measured with an
in situ optode technique (after Wenzhöfer et. al. 2001b).
6.5
Significance and Quantitative Approaches