

182
Chapter 10: The Evaluation of Forecasts
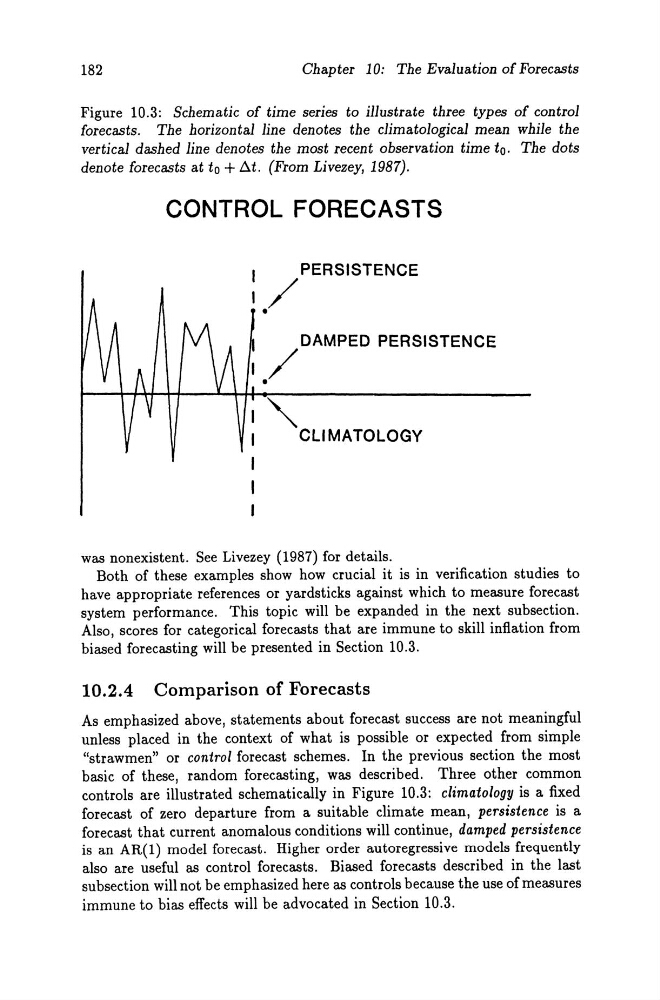
Figure 10.3: Schematic of time series to iIlustrate three types of control
forecasts. The horizontal line denotes the climatological mean while the
vertical dashed line denotes the most recent observation time to. The dots
denote forecasts at to + ßt. (From Livezey, 1987).
CONTROL FORECASTS
PERSISTENCE
./
1/ •
DAMPED PERSISTENCE
~ CU MATOLOGY
was nonexistent. See Livezey (1987) for details.
Both of these examples show how crucial it is in verification studies to
have appropriate references or yardsticks against which to measure forecast
system performance. This topic will be expanded in the next subsection.
Also, scores for categorical forecasts that are immune to skill inflation from
biased forecasting will be presented in Section 10.3.
10.2.4 Comparison of Forecasts
As emphasized above, statements about forecast success are not meaningful
unless placed in the context of what is possible or expected from simple
"strawmen" or control forecast schemes. In the previous section the most
basic of these, random forecasting, was described. Three other common
controls are illustrated schematically in Figure 10.3: climatology is a fixed
forecast of zero departure from a suitable climate mean, persistence is a
fore cast that current anomalous conditions will continue, damped persistence
is an AR(l) model forecast. Higher order autoregressive models frequently
also are useful as contral forecasts. Biased forecasts described in the last
su bsection will not be em phasized here as controls because the use of measures
immune to bias effects will be advocated in Section 10.3.
Chapter 10: The Evaluation of Forecasts
Figure 10.3: Schematic of time series to iIlustrate three types of control
forecasts. The horizontal line denotes the climatological mean while the
vertical dashed line denotes the most recent observation time to. The dots
denote forecasts at to + ßt. (From Livezey, 1987).
CONTROL FORECASTS
PERSISTENCE
./
1/ •
DAMPED PERSISTENCE
~ CU MATOLOGY
was nonexistent. See Livezey (1987) for details.
Both of these examples show how crucial it is in verification studies to
have appropriate references or yardsticks against which to measure forecast
system performance. This topic will be expanded in the next subsection.
Also, scores for categorical forecasts that are immune to skill inflation from
biased forecasting will be presented in Section 10.3.
10.2.4 Comparison of Forecasts
As emphasized above, statements about forecast success are not meaningful
unless placed in the context of what is possible or expected from simple
"strawmen" or control forecast schemes. In the previous section the most
basic of these, random forecasting, was described. Three other common
controls are illustrated schematically in Figure 10.3: climatology is a fixed
forecast of zero departure from a suitable climate mean, persistence is a
fore cast that current anomalous conditions will continue, damped persistence
is an AR(l) model forecast. Higher order autoregressive models frequently
also are useful as contral forecasts. Biased forecasts described in the last
su bsection will not be em phasized here as controls because the use of measures
immune to bias effects will be advocated in Section 10.3.